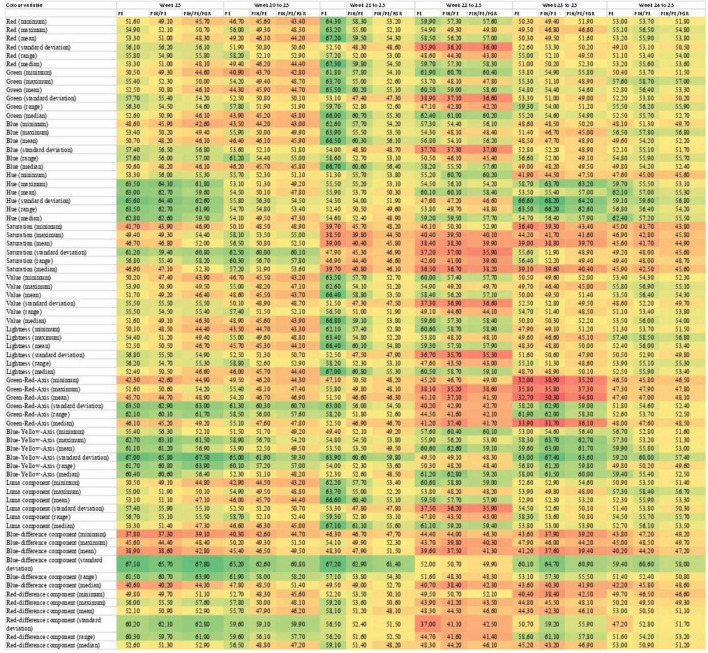
FIGURE 3.
Heat map of the area under the curve (AUC) for each individual color variable for the outcomes of PE, PE and/or PIH, and PE and/or PIH, and/or IUGR, at 25 weeks of gestation and for the weekly color change between 20 and 25 weeks of gestation, respectively. The AUC is a value between zero and 100 and the colors of the heat map visualize the individual values. Green is closer to 100 and red is closer to zero. The color variables are derived from the four dominant color spaces. R, red; G, green; B, blue; H, Hue; S, saturation; V, value; Y, luma component; Cb, blue-difference component; Cr, red-difference component; L, lightness; A, green-red-axis; B, blue-yellow-axis.

