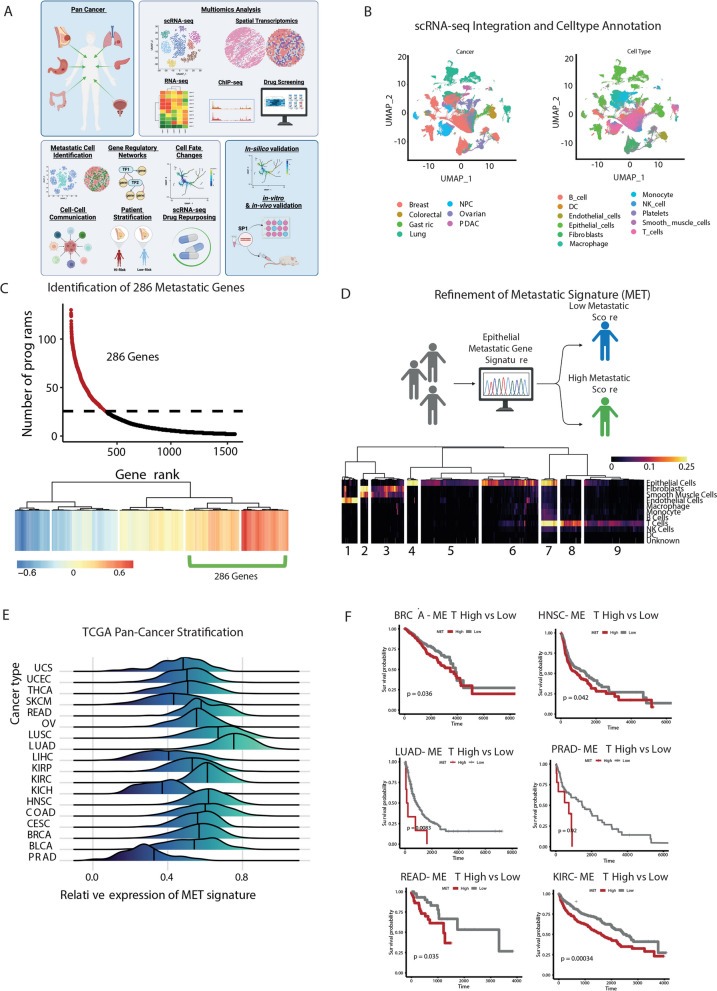
Fig. 1.
Defining the core transcriptional landscape driving pan-cancer metastasis. A Graphical overview of the study, highlighting the cancer types examined, the multi-omics data utilised, the in-silico analysis methods employed, and the validation approaches for in silico findings. B UMAP projection of pan-cancer single-cell RNA-seq (scRNA-seq) data, annotated by cancer types and cell types. C The top panel shows the number of programs associated with the expression of metastatic gene lists, while the bottom panel presents the clustering analysis of genes frequently associated with 25 or more programs across all samples, ranked by their association with the number of archetypes. D The top panel illustrates the aim to define a refined epithelial cell type–specific signature from 286 genes, and the bottom panel displays the cell type specificity scores of each metastatic gene across different cell types, with clusters annotated to highlight cluster-specific expression of the signature. E Metastatic scoring of each TCGA pan-cancer patient, stratifying them into high and low metastatic potential groups. F Kaplan–Meier survival plot of patients stratified by metastatic potential genes in the TCGA pan-cancer cohort

