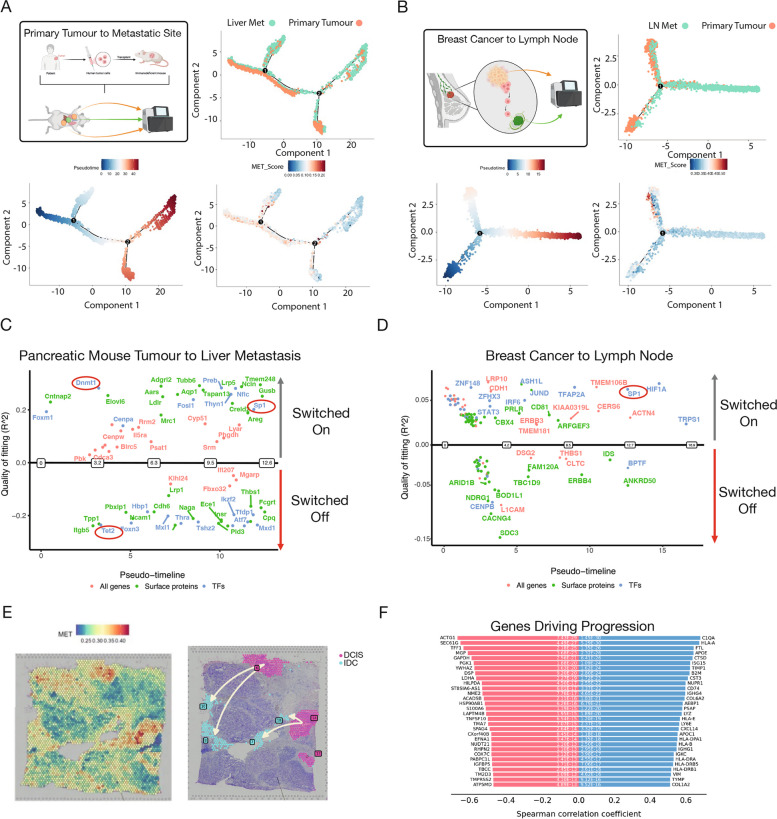
Fig. 4.
Refined metastatic signature can recapitulate the cascade of tumour migration. A Monocle 2 trajectory analysis of paired patient-derived xenograft (PDX) pancreatic ductal adenocarcinoma (PDAC) and liver metastasis cells, with cells coloured by site, pseudotime, and metastatic score using UCell. B Monocle 2 trajectory analysis of paired breast cancer and lymph node metastasis cells, similarly, coloured by site, pseudotime, and metastatic score using UCell. C Differential gene expression along pseudotime for the PDX PDAC and liver metastasis pair, quality of fitting is calculated using McFadden's Pseudo R2 D Differential gene expression along pseudotime for the breast cancer and lymph node metastasis pair, quality of fitting is calculated using McFadden's Pseudo R2 (E) Spatial transcriptomic profiling of a breast cancer patient, scored for metastatic potential using UCell. F Trajectory analysis of the breast cancer spatial transcriptomics data, highlighting genes that drive the observed cellular trajectories

