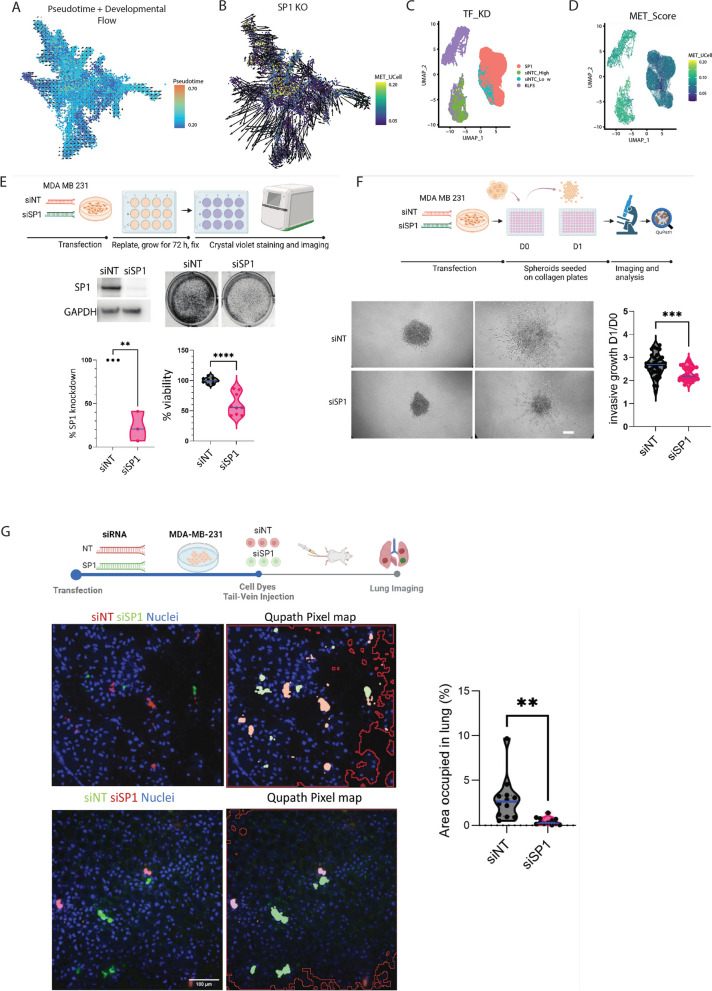
Fig. 8.
SP1 and KLF5 have opposing roles in the metastasis program. A Pseudotime calculation of cells, showing overlap with metastatic scoring and the transition from low to high metastatic potential cells. B In silico perturbation of SP1 alters the metastatic transition trajectory. C UMAP projections of MB231 (high metastatic) and HCC1806 (low metastatic) cells, coloured by transcription factor knockdown (TF KD) and non-targeting control (siNTC) cohorts. D UMAP projection with cells scored from low to high metastatic potential using UCell. E Representative immunoblotting images of SP1 knockdown and non-targeting control (NT) MDA-MB-231 cells (n = 4). F Representative Crystal Violet assay images for viability in SP1 knockdown and non-targeting control (NT) MDA-MB-231 cells (n = 4), with quantification of absorbance at 595 nm (right). G Representative images and quantitation of knockdown and control MDA-MB-231 spheroid growth embedded in Collagen-I at day 0 (D0) and day 1 (D1), scale bar = 50 μm (n = 3). H Schematic of lung colonisation assay using vital dye-stained SP1 knockdown (red) and control MDA-MB-231 cells (green) co-injected into the tail vein of NXG mice. Lungs were imaged 24 h post-injection, displaying representative images with a heatmap analysis using QuPath pixel mapping. Cell nuclei are stained with Hoechst 33,342. Quantitation of the area occupied by fluorescent cells in the lungs (%) for siNT and siSP1 MDA-MB-231 cells is shown (right). Scale bar = 100 μm. The same experiment was repeated with inverted vital dye colours (SP1 knockdown in green and NT controls in red) (n = 2). Violin plots display median (blue) with interquartile ranges. p-values were calculated using unpaired t-tests. All n numbers indicate independent experiments unless otherwise stated

