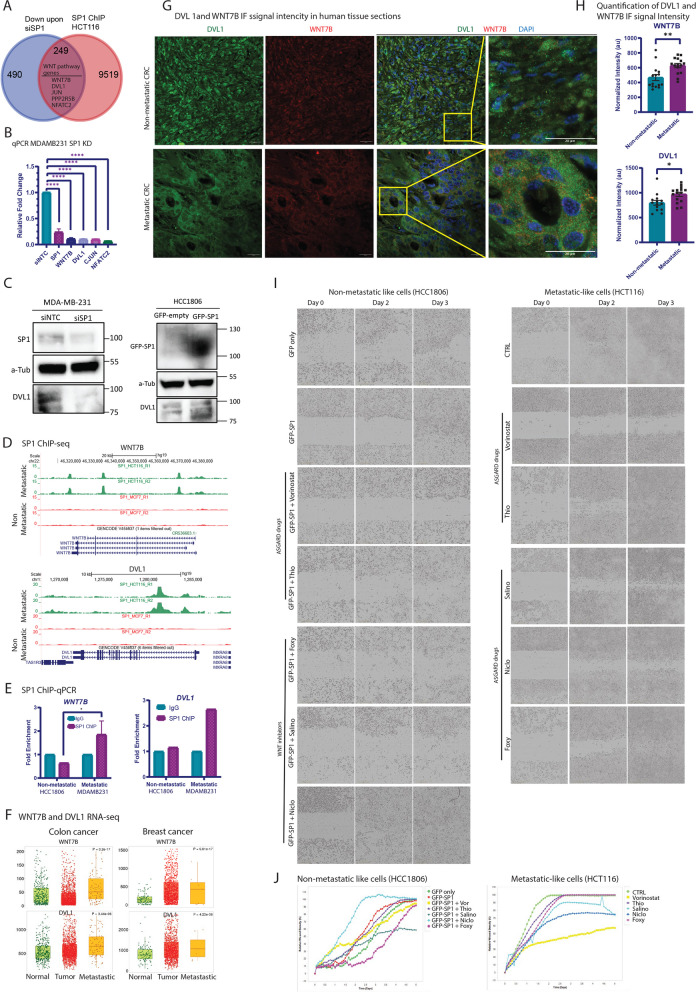
Fig. 9.
Induction of WNT pathway genes by SP1 drives metastatic features. A Venn diagram shows overlap of SP1 bound genes with downregulated genes upon siSP1. The five genes shown inside the venn diagram are WNT pathway genes. B The bar graph shows relative qPCR fold change for the expression of GAPDH, SP1, WNT7B, DVL1, JUNC and NFATC2 upon SP1 knockdown in MDA-MB-231 cells. Each bar indicates the mean of replicate values. Error bar indicates SEM. For statistical analysis, student ‘s t-test is performed (* p < 0.05, *** p < 0.001). Gene expression was normalized to the corresponding expression of each gene upon siNTC control knockdown in MDA-MB-231. C Immunoblotting for SP1 knockdown in MDA-MB-231 (left plot) cells against SP1, a-Tubulin and DVL1. A-Tubulin served as a loading control. siNTC: siRNA for non-targeting control. The right plot showing Immunoblotting for GFP-SP1 overexpression in HCC1806 cells against GFP, a-Tubulin and DVL1. A-Tubulin served as a loading control. siNTC: siRNA for non-targeting control. D The browser tracks show SP1 binding signal at hallmark WNT pathway genes WNT7B and DVL1 in HCT116 and MCF7 cells. E ChIP-qPCR relative fold enrichment for SP1 binding at the promoter sites of WNT7B and DVL1. Each bar indicates the mean of replicate values. Error bar indicates SEM. For statistical analysis, student ‘s ttest is performed (* p < 0.05). IgG is used as a negative antibody control for ChIP. Non-metastatic: HCC1806 cells; metastatic: MDA-MB-231 cells. F The boxplot showing expression of WNT7B and DVL1 in normal, primary and metastatic tumors from colon and breast cancer patients. The expression levels were derived from TNMplot database. G Representative images of Immunofluorescent staining for non-metastatic and metastatic CRC human tissue section. DVL1 in green, WNT7B in red and DAPI in blue. Scale bar indicates 20 microns. Region of interest is marked in dashed yellow rectangle. H) Quantification of immunofluorescent signal intensity for WNT 7B and DVL1. Each bar represents the mean intensity. Error bars indicate SEM. Each dot represents the quantification value for each individual region. For statistical analysis, student ‘s t test was performed (* p < 0.05, ** p < 0.01). I Representative bright field images of incucyte experiment for SP1 overexpressing HCC180 and highly metastatic HCT116 cancer cells with and without treatment with the five selected drugs (vorinostat, Thiaridazine, Niclosamide, Salinomycin and Foxy 5 on Day 0, 2 and 3. J Quantification for the incucyte experiment coupled with all drug treatments shown in (I). Vor: vorinostat, Thio: thioridazine, Salino: salionomycin, Niclo: niclosamide, Foxy: Foxy-5

