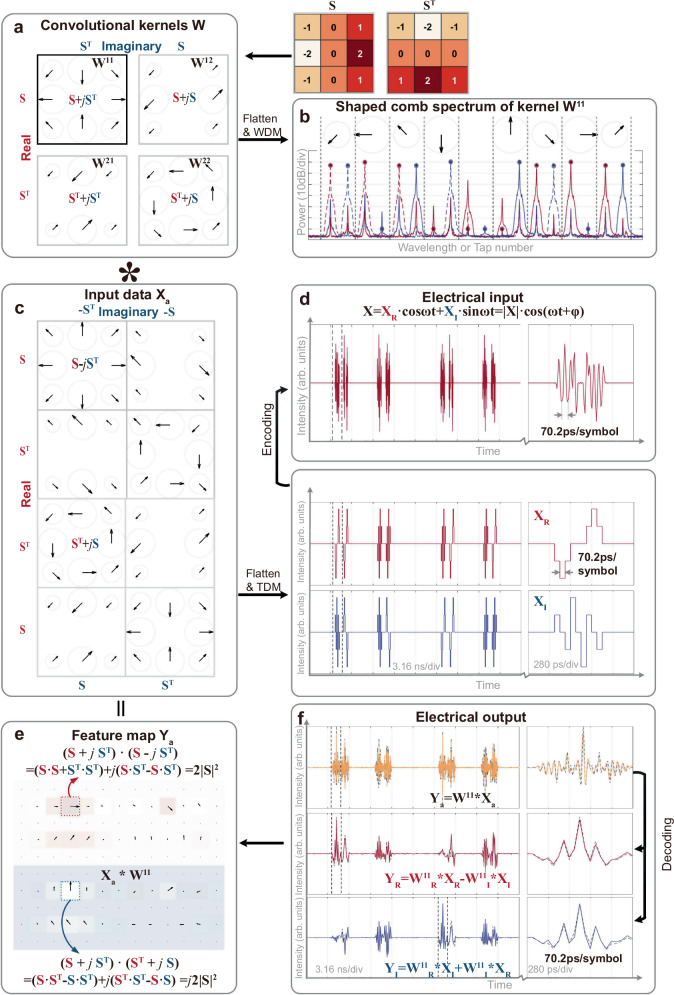
Fig. 3. Experimental results of CVOCA with input data Xa.
a Four convolution kernels W11, W12, W21, and W12 were designed based on a real kernel S and its transpose ST: W11 = S + j·ST, W12 = S + j·S, W21 = ST + j·ST, W22 = ST + j·S. b The optical spectrum shows the shaped comb for kernel W11, with solid and dashed lines corresponding to positive and negative weights, and dots and stars denoting measured and desired weights. c The designed input data based on a real kernel S and its transpose ST. d The electrical waveforms generated from the input data. e The output feature of complex-valued convolution between the input data and kernel W11. f The electrical waveforms show the convolution results, with the experimental and simulated results denoted as solid and dashed lines, respectively. The feature maps are experimental results for kernel W11, featuring distinct locations of maximum real and imaginary elements, as highlighted in dashed boxes.

