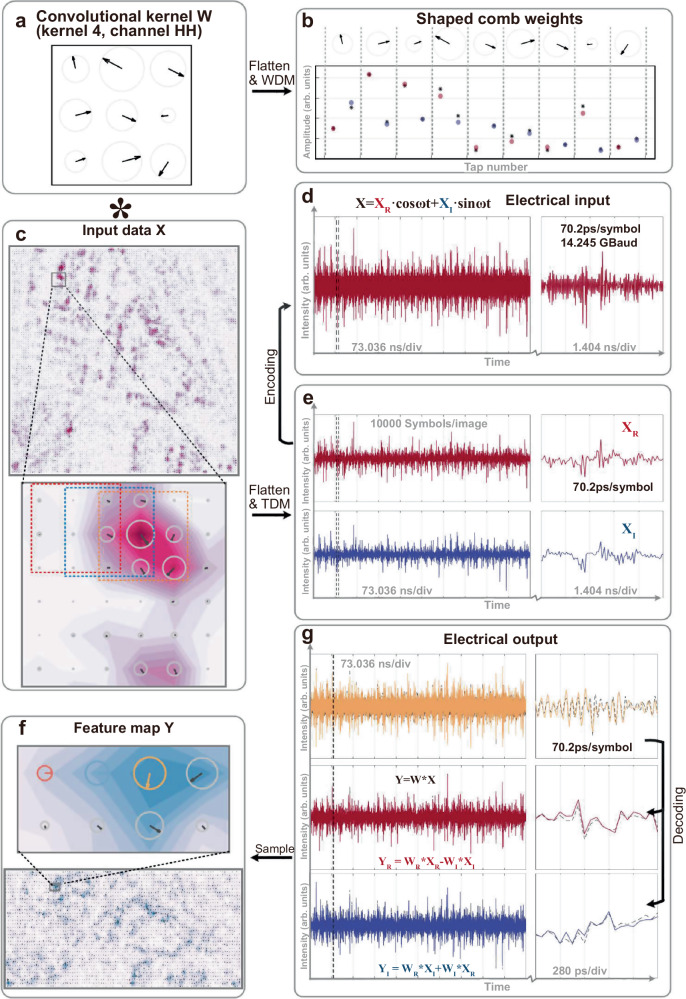
Fig. 6. Experimental results of SAR image recognition (kernel 4, HH channel).
a The used kernel 4 in the channel HH. b The corresponding shaped comb weights. c The input SAR image where the dashed boxes on the zoom-in input data matrix denote the sliding convolution window and correspond to the highlighted elements in the zoom-in feature maps. d The input electrical waveform includes both real parts and imaginary parts. e The electrical waveforms represent the real parts and imaginary parts, respectively. f The output feature map. g The electrical output where the experimental and simulated results are denoted as solid and dashed grey lines, respectively.

