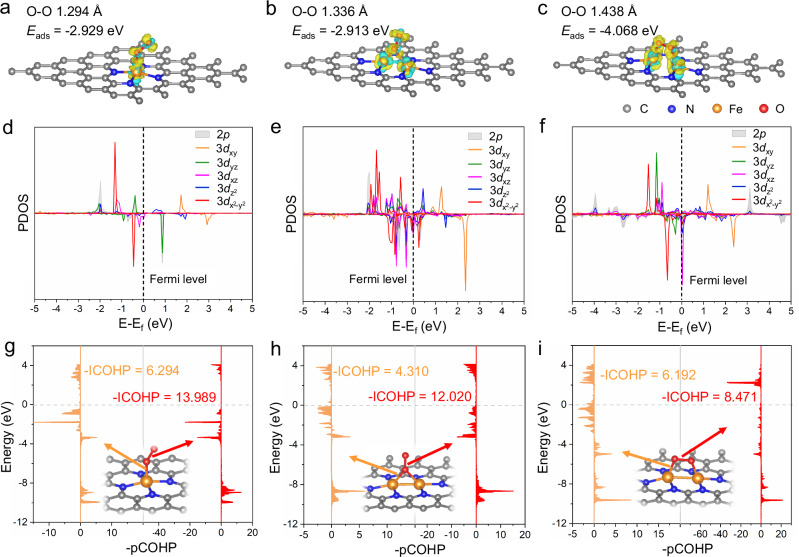
Fig. 4. DFT studies.
The charge density difference of (a) Fe1-N4-O2, (b) Fe2-N6-O2-ver, and (c) Fe2-N6-O2-par, respectively. The isosurface value of the color region is 0.01 Bohr-3. Yellow and cyan regions refer to the increased and decreased charge distribution, respectively. PDOS for Fe 3 d orbitals and O 2p orbitals of (d) Fe1-N4-O2, (e) Fe2-N6-O2-ver, and (f) Fe2-N6-O2-par. pCOHP of (g) Fe1-N4-O2, (h) Fe2-N6-O2-ver, and (i) Fe2-N6-O2-par at different positions. The insets in panels g-i show the corresponding structures.

