. 2025 Jan 3;15(1):467–476. doi: 10.1039/d4ra05688d

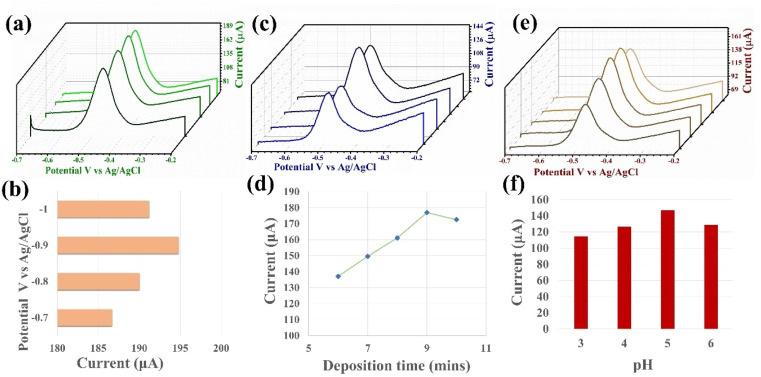
Fig. 4. (a) Optimization of deposition potential on SWASV detection of Pb2+ by PPy/MoS2/GCE (pH = 5.0 (0.1 M Na–Ac), deposition time (min) = 10 and [M]2+ = 200 nM) and (b) respective bar graph of optimization of deposition potential from −0.7 to −1.0. (c) Optimization of deposition time on SWASV detection of Pb2+ by PPy/MoS2/GCE (pH = 5.0 (0.1 M Na–Ac), deposition potential (V) = −0.9 and [M]2+ = 200 nM) and (d) respective line graph of optimization time from 6 to 10 min. (e) Optimization of pH (0.1 M Na–Ac) for SWASV sensitivity of PPy/MoS2/GCE (deposition potential (V) = −0.9, deposition time (min) = 10 and [M]2+ = 200 nM) and (f) respective bar graph of optimization of pH from 3 to 6.

Fig. 4