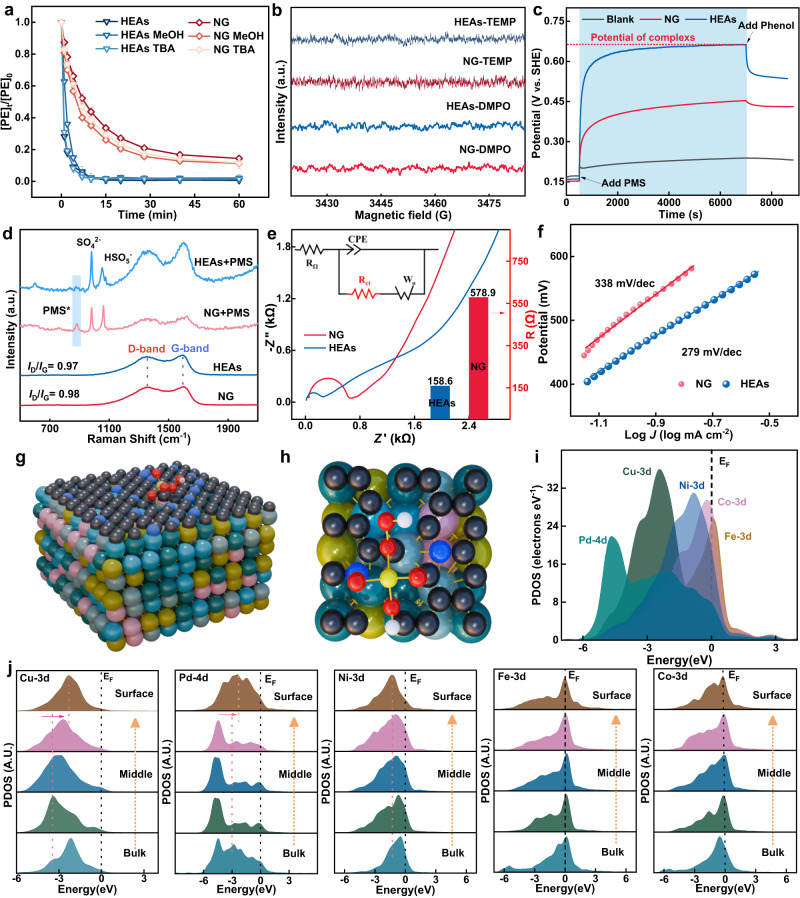
Fig. 3. Identification of active species.
a Quenching effects by various scavengers. The error bars represent the standard deviations from triplicate tests. Dosage: [Phenol]0: 0.1 mM, PMS: 0.25 mM, scavengers: 2.5 mM, reaction solution: 50 mL, catalyst: 0.1 g L−1. b EPR tests were performed on DMPO and TEMP adducts within the HEAs-PMS system during PMS activation. c The open circuit potential on HEAs−GCE and NG−GCE electrode. d In situ Raman spectra of HEAs-PMS and NG-PMS in the liquid solution. e Nyquist plots and fitting calculations of internal resistance for HEAs and NG. f Tafel slope on the HEAs−GCE and NG−GCE electrodes in phenol solutions. g The side view of the structural configuration of PMS on HEAs. h The top view of the structural configuration of PMS on HEAs. i The PDOSs of the HEAs. j The site-dependent PDOSs of Cu, Pd, Ni, Fe, and Co in HEAs.

