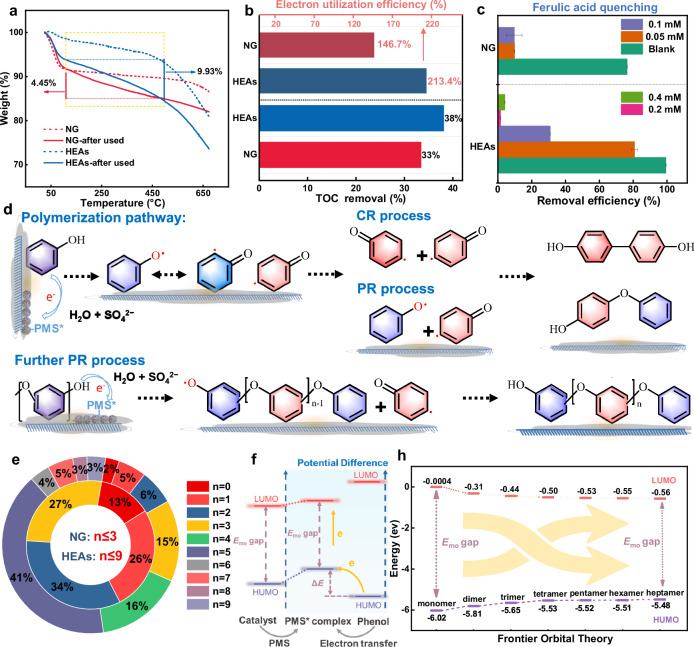
Fig. 4. Characteristics of the polymerization products.
a TGA curves of HEAs and NG before and after the reaction. b HEAs-PMS and NG-PMS aqueous solution systems final TOC removal efficiency, and electron utilization. c The effect of different concentrations of FA on the phenol removal efficiency in the NG-PMS and HEAs-PMS systems (The error bars represent the standard deviations from triplicate tests). d Proposed reaction pathways of the oxidative coupling and polymerization of phenol on the catalyst surface. e The distribution of different units polymerization-degree products on the surface of NG and HEAs catalysts. f Schematic diagram of the frontier orbital theory for catalytic polymerization of phenol on the catalyst surface. h Calculated frontier orbital diagrams for different units polymerization-degree phenol. Dosage: [Phenol]0: 0.1 mM, PMS: 0.25 mM, reaction solution: 50 mL, catalyst: 0.1 g L−1.

