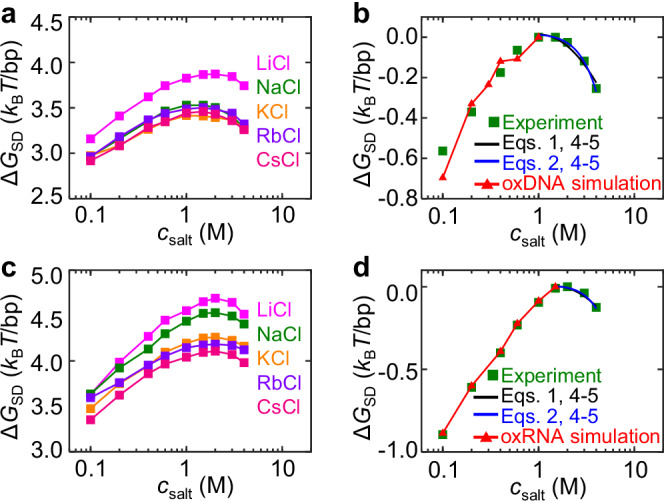
Fig. 2. Comparison of experimental and simulation results.

In MT experiments, the averages and standard errors from three molecules are plotted as data points and error bars. In MD simulations, the averages and standard errors from five equal intervals after equilibrium are plotted as data points and error bars. Source data are provided as a Source Data file. a The free energy difference between duplex and stretched single-stranded DNA states () as a function of salt concentration ) from MT experiments. b Variation of , . The red curve is obtained from oxDNA simulation. c, d Similar results for RNA duplex stability and the red curve are obtained from oxRNA simulation. In (b) and (d), all experimental curves are shifted to make at for the salt type of NaCl, and the black curves are calculated from Eqs. 1, 4–5, and the blue curves from Eqs. 2, 4–5.
