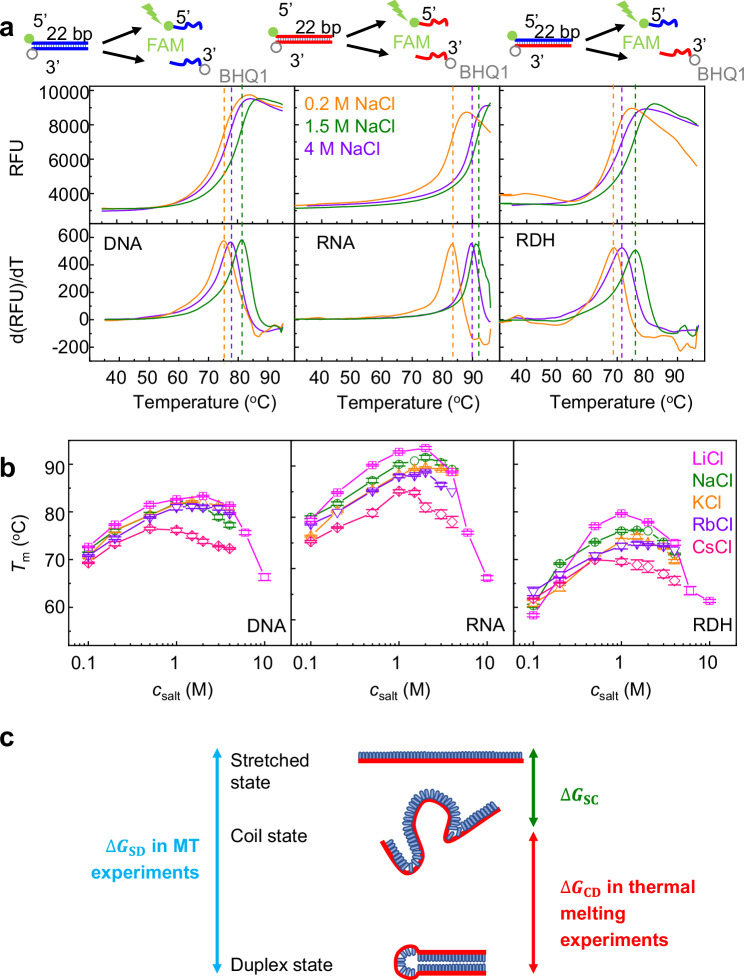
Fig. 3. Measurement of NA duplex stability by thermal melting.
Source data are provided as a Source Data file. a Representative melting curves obtained from a fluorescence quenching test. The top panels are the fluorescence intensity as a function of temperature, and the bottom panels are the derivative of fluorescent intensity versus temperature. b Melting temperature Tm as functions of . The averages and standard errors from several independent experiments (six for NaCl and three for other ions) are plotted as data points and error bars. c Two different transitions in MT and thermal melting experiments.

