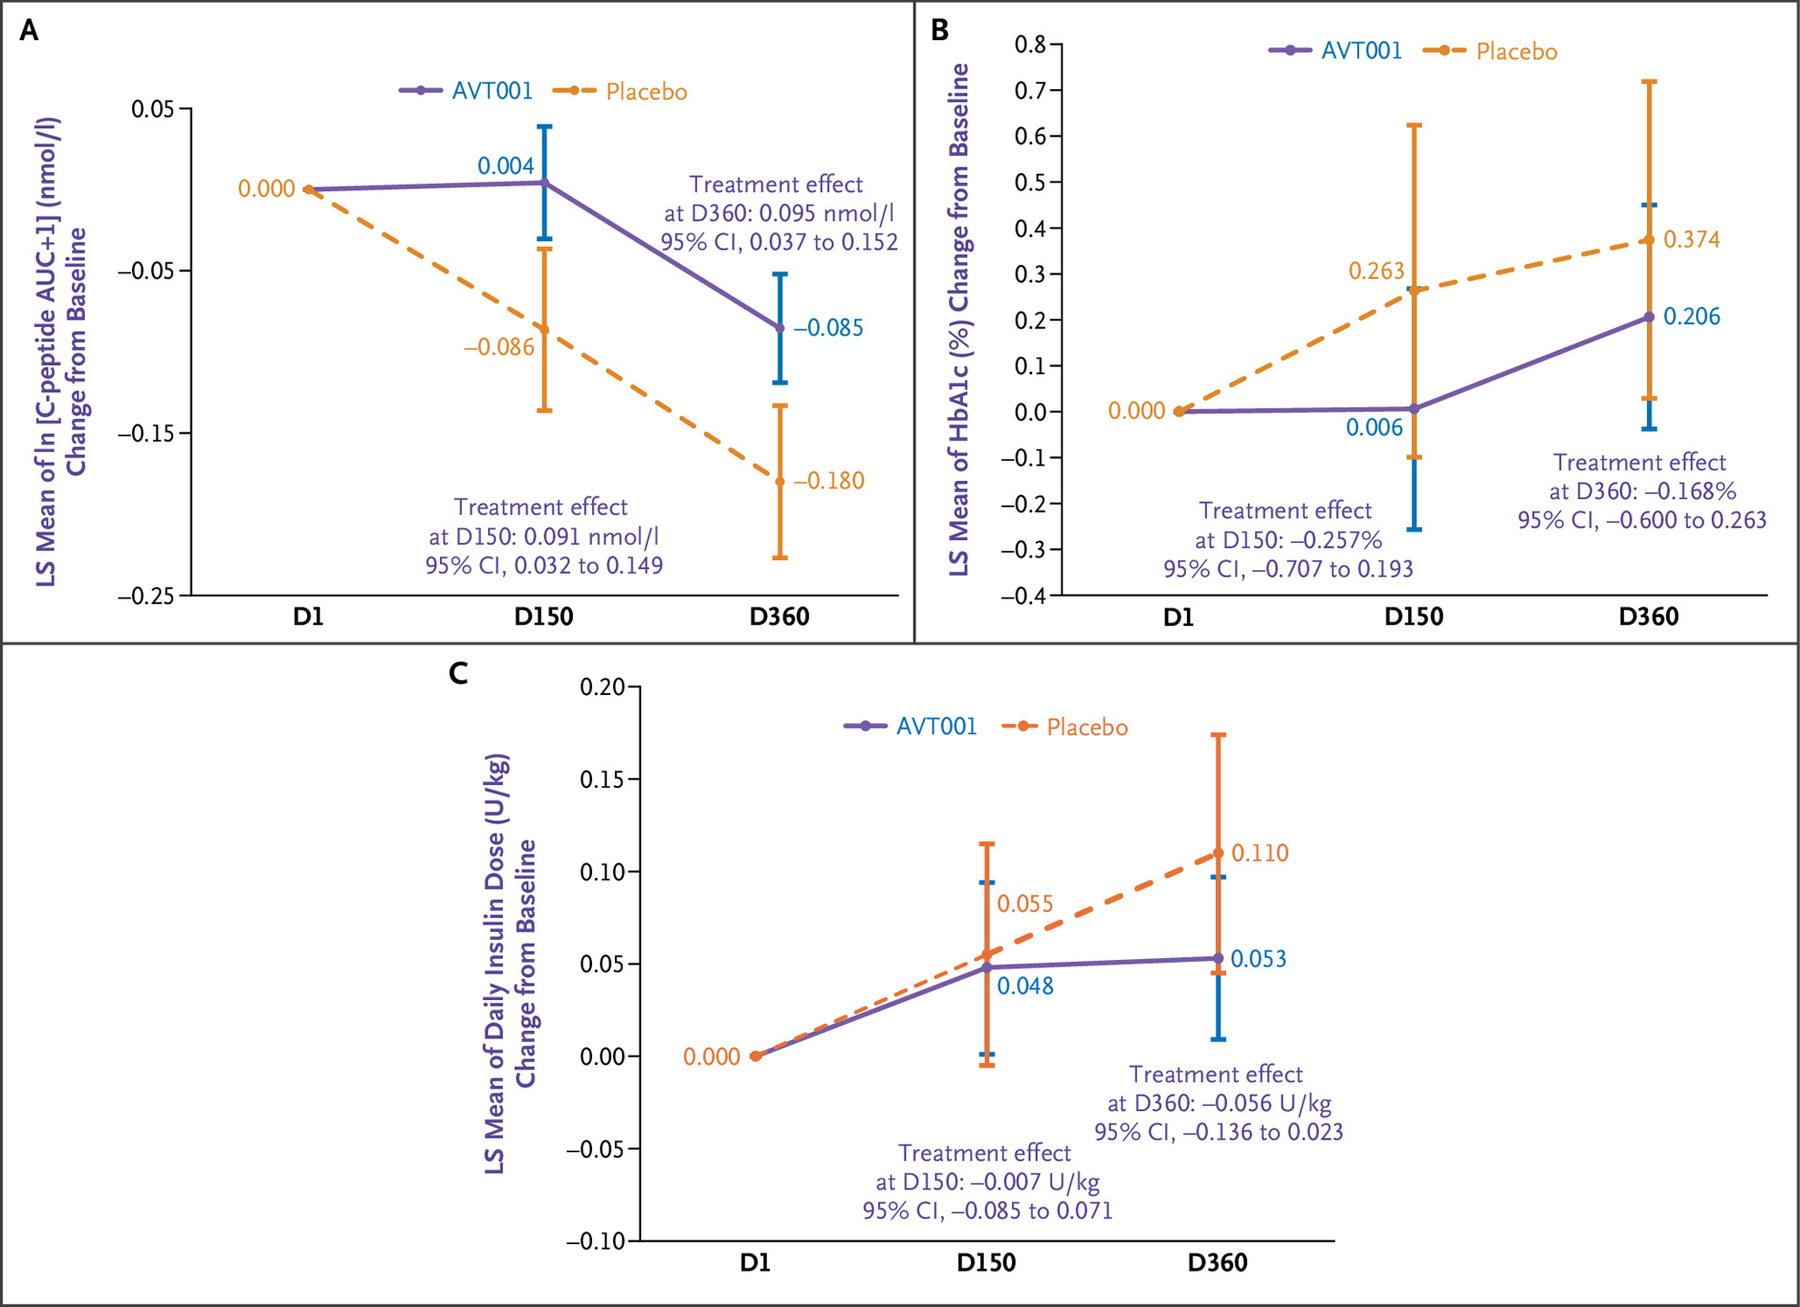
Figure 2.

LS Mean of ln[C-Peptide AUC+1] (nmol/l) Change from Baseline, Its 95% CI, and Treatment Effects of AVT001 versus Placebo at Visit D150 and Visit D360 Estimated by MMRM.
The change from baseline (D1) for ln[C-peptide AUC+1] is set as zero per definition (Panel A). LS mean of hemoglobin A1c (HbA1c; percentage) change from baseline, its 95% CI, and treatment effects of AVT001 versus placebo at visit D150 and visit D360 estimated by MMRM. Change from baseline for HbA1c is set as zero per definition (Panel B). LS mean of insulin use (U/kg/day) change from baseline, its 95% CI, and treatment effects of AVT001 versus placebo at visit D150 and visit D360 estimated by MMRM. Change from baseline insulin use is set as zero per definition (Panel C). The widths of all the CIs have not been adjusted for multiple comparisons and should not be used in place of hypothesis testing. AUC denotes area under the curve; CI, confidence interval; D, day; LS, least squares; and MMRM, mixed-effect model for repeated measurements.
