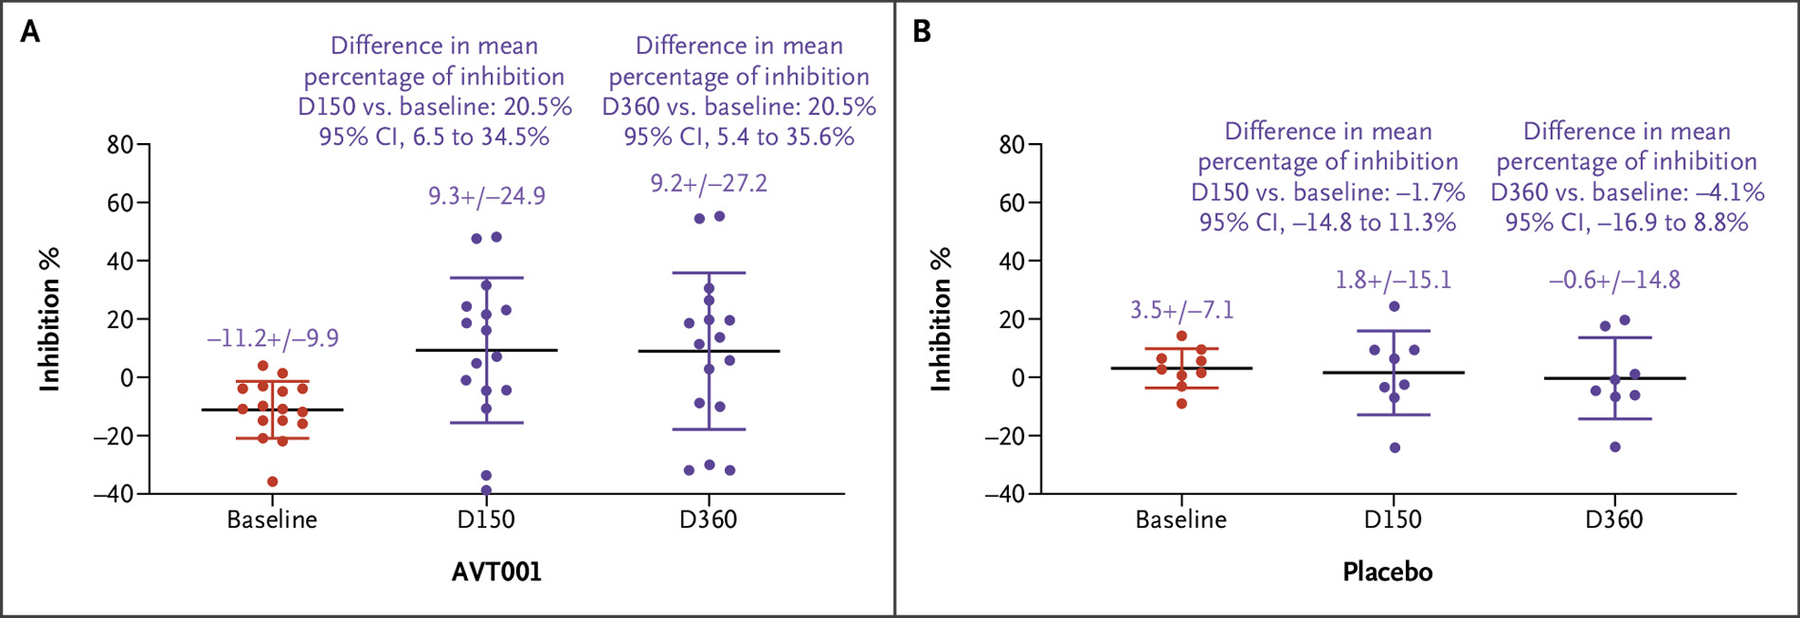
Figure 3.

Q/E CD8+ T Regulatory Cell–Based Inhibition Evaluated by the CD8+ T-Cell Inhibition Assay in Participants Who Received AVT001 Treatment.
CD8+ T cells, isolated from participants with type 1 diabetes (T1D) who were treated with AVT001 at screening (baseline), D150, and D360, were assessed for their specific recognition of the “common target structure” of the HLA-E/heat shock protein 60sp complex expressed on the TH1 target cells by the CD8+ T-cell inhibition assay. More details can be found in Section 3 of the Supplementary Appendix. Data show the mean ± standard deviation of 16 participants with T1D receiving AVT001 treatment. The difference of means at D150 versus at baseline in AVT001 was 20.5% (95% CI, 6.5 to 34.5%). The difference of means at D360 versus at baseline was 20.5% (95% CI, 5.4 to 35.6%) (Panel A). Q/E CD8+ T regulatory cell function evaluated by the CD8+ T-cell inhibition assay in participants who received placebo. The difference of means at D150 versus at baseline in placebo was −1.7% (95% CI, −14.8 to 11.3%), and the difference of means at D360 versus at baseline was −4.1% (95% CI, −16.9 to 8.8%), which showed no statistically significant difference between the two groups (Panel B). The widths of the CIs have not been adjusted for multiple comparisons and should not be used in place of hypothesis testing. CI denotes confidence interval; D, day; and Q/E CD8+, Qa-1 (mouse homologue of human leukocyte antigen E)/human leukocyte antigen E–restricted CD8+.
