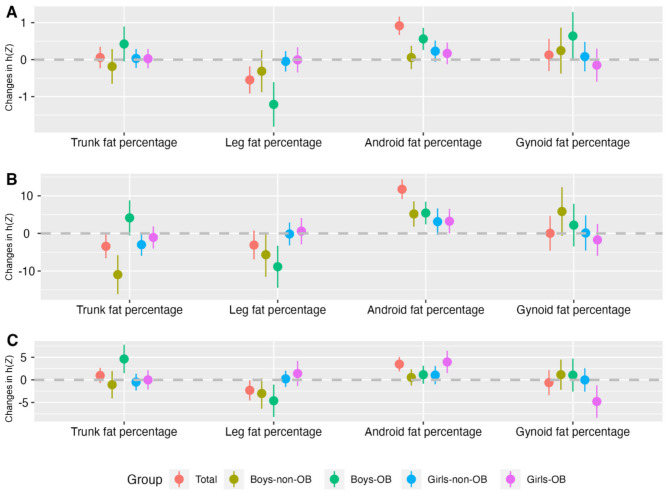
Fig. 2.
The effect estimates and 95%CI of four body fat percentage distribution parameters on BP levels of participants
Note: A, HBP; B, SBP; C, DBP; HBP, high blood pressure; SBP, systolic blood pressure; DBP, diastolic blood pressure; x-axis, four body fat percentage indicators; y-axis, changes in exposure effect value estimated by the function, where a gaussian link function was used for SBP or DBP, and a binomial link function was used for HBP. The results were presented as changes in exposure effect value when one body fat percentage indicator was at the 75th vs. 25th percentile, while the other body fat percentages were fixed at their 50th percentiles

