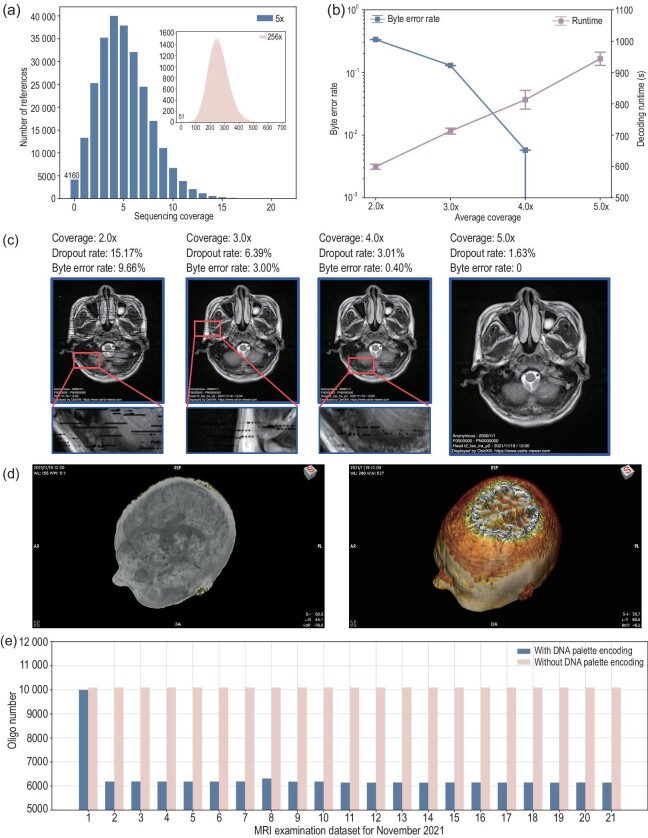
Figure 2.
Experimental performance of our coding scheme. (a) Experimental results of the master pool with an average coverage of 256 and the dilution pool with an average coverage of 5
 . (b) Byte error rate and decoding time at average coverage ranges of 2
 , 3
, 3 , 4
, 4 and 5
and 5 . At each coverage rate, 10 independent experiments were conducted. (c) Reconstructed image pixel data using our method. (d) Maximum intensity projection image and three-dimensional volume rendering image reconstructed from the decoded data. (e) The number of oligos encoded from 21 DICOM files obtained from the November 2021 MRI examination, including results encoded by the DNA palette and indexed RS codes, is presented. The oligo count of the first file, which did not undergo differential encoding, showed a slight reduction. Other files exhibited a significant reduction in the number of encoded oligos.

