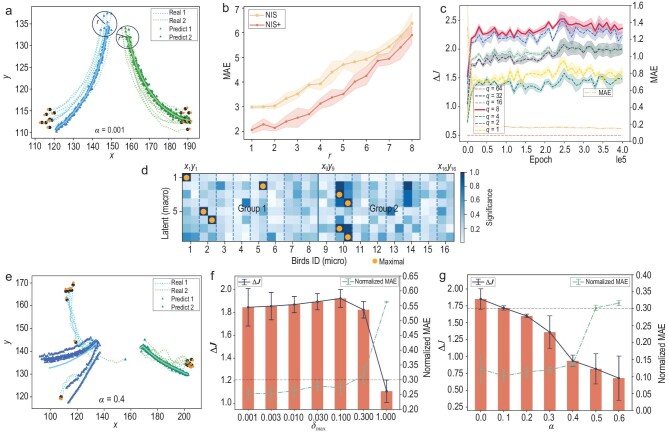
Figure 4.
The experimental results of NIS+ on learning the collective flocking behaviors of the boids model. Panels (a) and (e) present real and predicted data on boid trajectories. Concretely, they present the comparison results for multi-step predictions under the condition of two separating groups, and random deflection angles. Panel (b) showcases the escalation of MAE for multi-step predictions as the radius r, which represents the range of initial positions of boids in (a), extends beyond the limits of the training data. Panel (c) depicts the trend of  changes with training epochs of NIS+ using different hyperparameters of q, which represents the scales of different macro-states. Panel (d) presents the saliency map, which visually depicts the association between each macroscopic dimension and the spatial coordinates of each boid. The interpretation can be found in Section S6.2. Panels (f) and (g) show the changes in
  and normalized MAE under different noise levels for (f) the extrinsic noise (
 ) and (g) intrinsic noise (
 ). In both (f) and (g), the horizontal lines represent the threshold 0.3 for the violation of the constraint of error in Equation (1).

