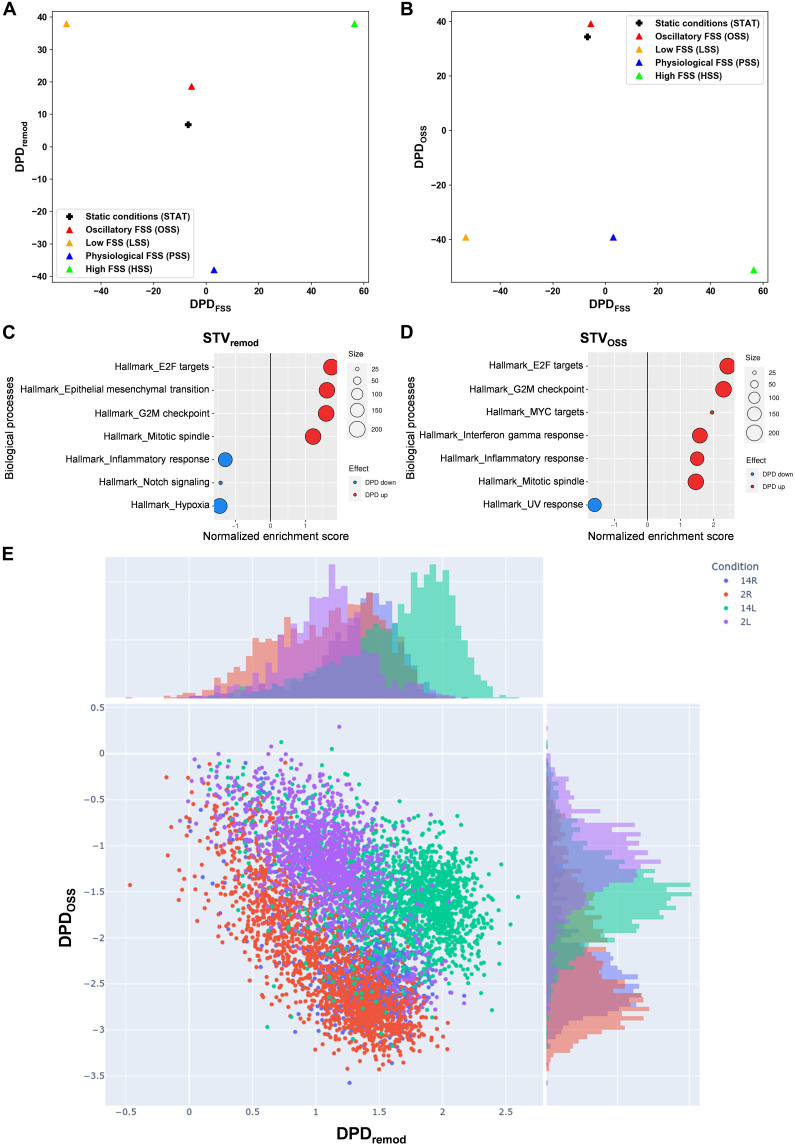
Fig. 1. cSTAR analysis of EC states under different flow conditions.
(A to D) RNA-seq data from ECs under OSS, LSS, PSS, HSS, or STAT conditions for 24 hours were analyzed, and DPD scores were calculated. (A) Two-dimensional (2D) plot of phenotypic scores in the DPDFSS and DPDremod plane. (B) 2D plot of phenotypic scores in the DPDFSS and DPDOSS plane. (C and D) Top GSEA Hallmark (HM) gene sets that contribute to the STVremod [(C)] and STVOSS [(D)]. The components of STVs were used as the GSEA input for the GSEA hallmark gene set. Positive-normalized enrichment score (red) reflects an increase in a molecular process while moving along the corresponding STV, and negative-normalized enrichment score (blue) reflects a decrease. Size of circles corresponds to the number of genes in STV corresponding to the specific GSEA term. (E) Scatter plot of the DPDremod and DPDOSS scores calculated for in vivo single-cell RNA-seq data (33) from the left carotid artery partial ligation mice model: 2L, 2 days left carotid artery; 2R, 2 days right carotid; 14L,14 days left carotid; 14R, 14 days right carotid. Histograms on the top and right present distributions of DPD values across one axis.

