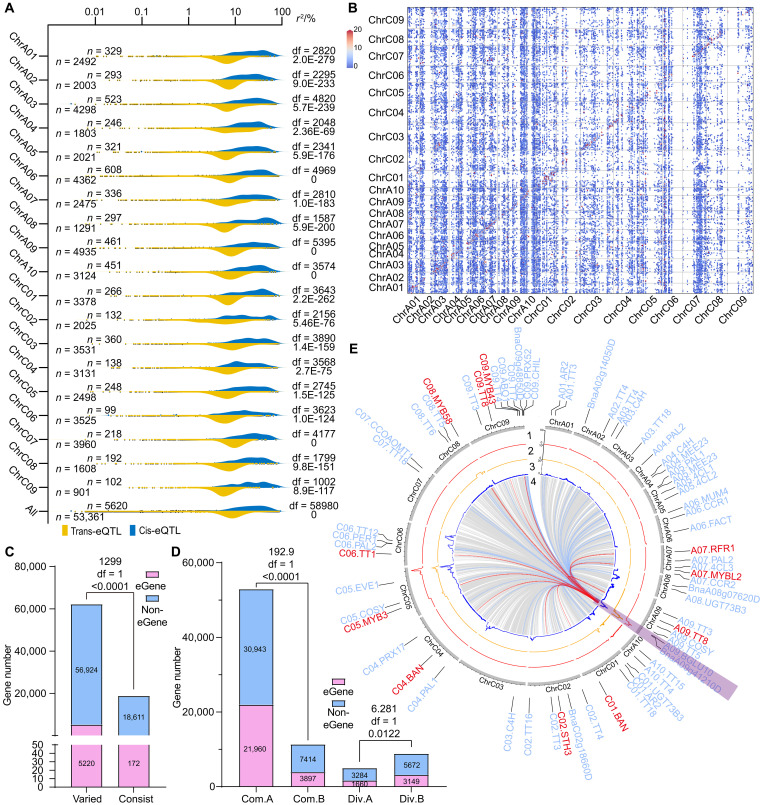
Fig. 2. The distribution of eQTLs.
(A) The r2 distribution of cis-eQTLs and trans-eQTLs across the 19 chromosomes and the entire genome. Each point represents one eQTL, and the degree of freedoms (df) (above) and P values (below) are annotated on the right [two-tailed one-way analysis of variance (ANOVA)]. In addition, the number of cis-eQTL (above) and trans-eQTL (below) are annotated on the left. (B) The positions of eQTLs (x axis) and their corresponding eGenes (y axis) on 19 chromosomes displayed by dot plot. The dot color represents the LOD score of each eQTL. (C) The distributions of cis-eQTL eGenes (and non-eGenes) among the genes with sequence variations (“varied”) and without sequence variation (“consist”) between Ken-C8 and N53-2. The chi-square, df, and P value are annotated above the histogram (chi-square test). (D) The distributions of eGenes (and non-eGenes) among the common (“Com.”) and divergent (“Div.”) A/B compartments of Ken-C8 and N53-2. The chi-square, df, and P value are annotated above the histogram (chi-square test). (E) The trans-eQTLs within Hotspot 13 (highlighted in purple) and the positions of their corresponding eGenes. The meaning of each circle is as follows: (1 to 3): the QTL density of SLC (1), SCC (2), and SOC (3) (5, 42, 43); (4) the trans-eQTLs located in Hotspot 13. The blue lines and labels outside represent the structural eGenes of phenylpropanoid and flavonoid biosynthesis pathways, and the red lines and labels represent the regulator genes of those pathways.

