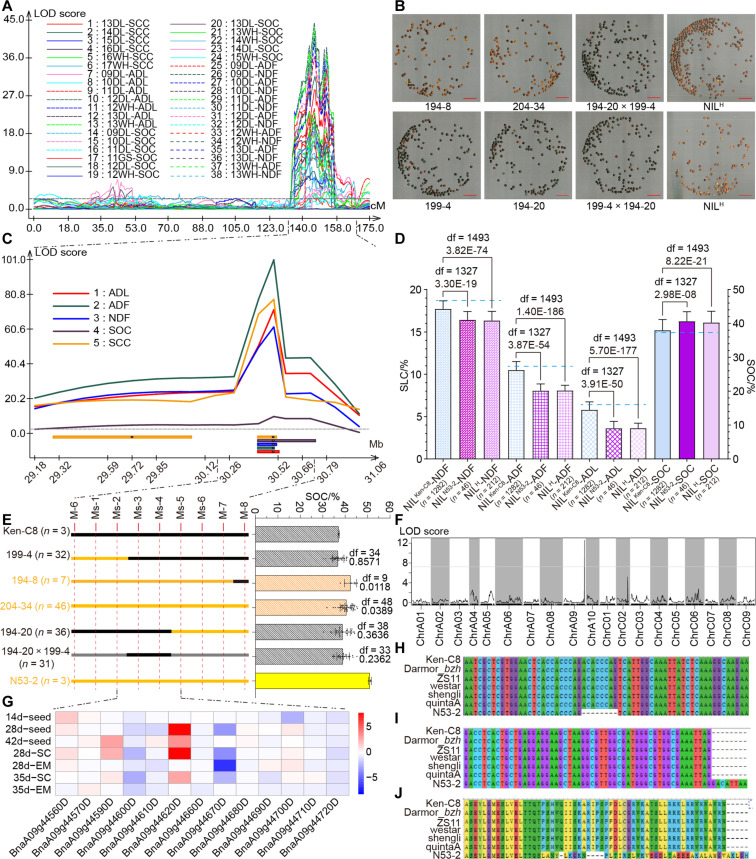
Fig. 3. The QTL fine mapping and candidate gene identification of Hotspot 13.
(A) The QTL mapping of SOC, SCC, NDF, ADF, and ADL on ChrA09 in the KN DH population (5, 42, 43). (B) The matured seeds of BC5F2 NIL lines. The red bars represent 10 mm. LOD, logarithm of the odds. (C) The QTL fine mapping of Hotspot 13 in the BC5F2 NIL population. (D) The SOC (right y axis) and SLC (left y axis) of different NIL groups. The blue horizontal line denotes the corresponding trait value of Ken-C8. The histograms represent the average values, and the error bars represent the SDs. The df and P values are annotated above histograms (two-tailed one-way ANOVA). The number of individuals in each group is annotated behind the x axis. (E) The genetic background and phenotype of five typical NIL subgroups and their parents. Chromosome fragments inherited from Ken-C8 and N53-2 are marked as black and orange, respectively, and gray indicates heterozygous regions. Names and individual numbers are labeled on the left, and the label colors represent their SCC. The bar graph presents the SOC of those subgroups and their parents, and each point represents one individual. The histograms represent the average values, and the error bars represent SDs. The df and P values are annotated above histograms (compared with Ken-C8, two-tailed one-way ANOVA). (F) The eQTL mapping of BnaA09g44670D. (G) Expression profile of the 13 expressed genes within uqA9-9 in the seed, seed coat (SC), and embryo (EM) of NIL lines. The heatmap was drawn by the log2(fold change) of the FPKM of NILKen-C8 versus NILN53-2. (H and I) The CDS sequence variation of BnaA09g44670D between N53-2 and other B. napus materials in the second exon (H) and the terminal region (I). (J) The amino acid sequence variation of BnaA09g44670D between N53-2 and other B. napus materials.

