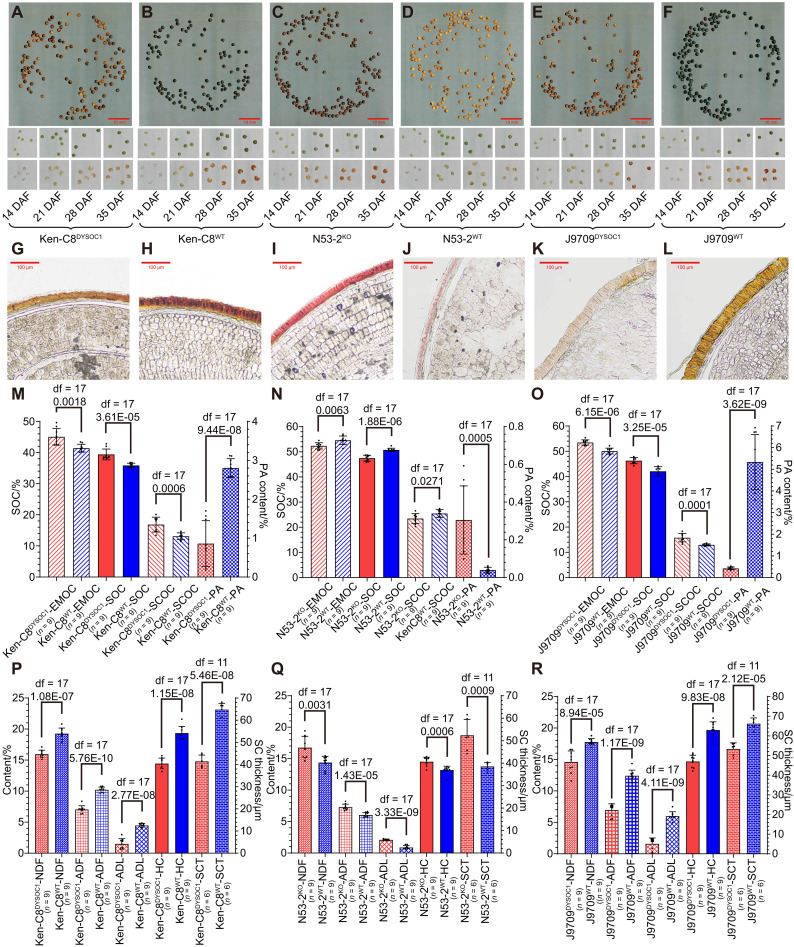
Fig. 4. The phenotype of DYSOC1 transgenic lines.
(A to F) The matured seeds (the first row), intact immature seeds (the second row), and immature seed coats stained by vanillin (the third row) of Ken-C8DYSOC1 (A), Ken-C8WT (B), N53-2KO (C), N53-2WT (D), J9709DYSOC1 (E), and J9709WT (F). The red bars represent 10 mm. (G to L) The matured seed slices of Ken-C8DYSOC1 (G), Ken-C8WT (H), N53-2KO (I), N53-2WT (J), J9709DYSOC1 (K), and J9709WT (L) that stained by phloroglucinol. The red bars represent 100 μm. (M to O) The EMOC, SCOC, SOC, and PA content of Ken-C8DYSOC1 and Ken-C8WT (M), N53-2KO and N53-2WT (N), J9709DYSOC1 and J9709WT (O). Among them, EMOC, SOC, and SCOC are plotted on the left y axis, and PA content is plotted on the right y axis. Each point represents one independent transgenic line, and the histograms represent the average values. The error bars represent SDs, and the df and P values are annotated above histograms (two-tailed one-way ANOVA). In addition, the number of independent transgenic lines is annotated behind the x axis. Three repetitions were conducted for each line, and the average value was adopted. (P to R) The NDF, ADF, ADL, HC, and SCT of Ken-C8DYSOC1 and Ken-C8WT (P), N53-2KO and N53-2WT (Q), J9709DYSOC1 and J9709WT (R). Among them, NDF, ADF, ADL, and HC are plotted on the left y axis, and SCT is plotted on the right y axis. Each point represents one independent transgenic line, the histograms represent the average values, and the error bars represent SDs, and the df and P values are annotated above histograms (two-tailed one-way ANOVA). In addition, the number of independent transgenic lines is annotated behind the x axis. Three repetitions were conducted for each line, and the average value was adopted. Specially, the SCT of each material was measured in six randomly selected areas in (G) to (L), respectively.

