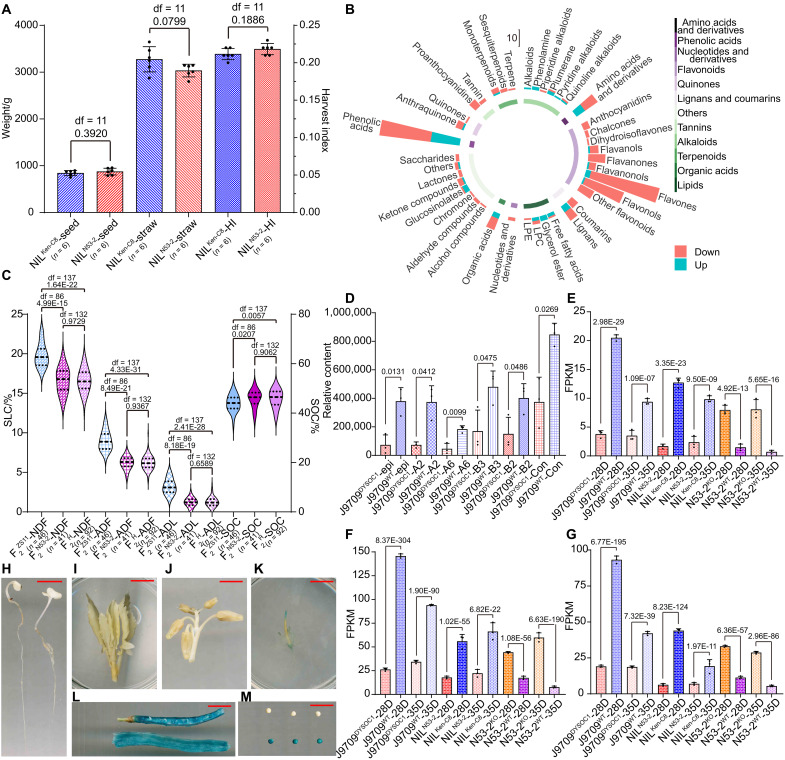
Fig. 5. DYSOC1 restricted PA and lignin monomer synthesis in the seed coat.
(A) The seed weight (left y axis), straw weight (left y axis), and harvest index (right y axis) of NILKen-C8 and NILN53-2 plots. Each point represents one plot, and the histograms represent the average values. The error bars represent SDs, and the df and P values are annotated above histograms (two-tailed one-way ANOVA). The numbers of plots are annotated behind the x axis. (B) DAMs detected between the seed coat of J9709DYSOC1 and J9709WT. The pillar height represents the DAM numbers, with DAM classification annotated in the inner circle. (C) The SLC (left y axis) and SOC (right y axis) of F2ZS11, F2N53-2, and F2H in the 22WH microenvironment. The top, middle, and bottom horizontal dashed lines of violin plots represent the first, second, and third quartiles of each group, respectively, and the df and P values are annotated above violin plots (two-tailed one-way ANOVA). The number of individuals of F2ZS11, F2N53-2, and F2H are annotated behind the x axis. (D) The relative content of 4β-8-epicatechin (epi), procyanidin A2 (A2), procyanidin A6 (A6), procyanidin B2 (B2), procyanidin B3 (B3), and coniferaldehyde (Con) in the seed coat of J9709DYSOC1 and J9709WT. Each point represents one replication, the histograms represent the average values, and the error bars represent SDs. The P values are annotated above histograms (Wald test). (E to G) Expression level of C06.TT1 (E), A09.TT8 (F), and C09.TT8 (G). Each point represents one replication, the histograms represent the average values, and the error bars represent SDs. The P values are annotated above histograms (Wald test). (H to M) The expression profile of DYSOC1 evaluated by the GUS stain in the seedling (H), leaf and stem (I), bud (J), flower (K), pseudoseptum [(L), above], silique peel [(L), below], embryo [(M), above], and seed coat [(M), below]. The red bars represent 10 mm.

