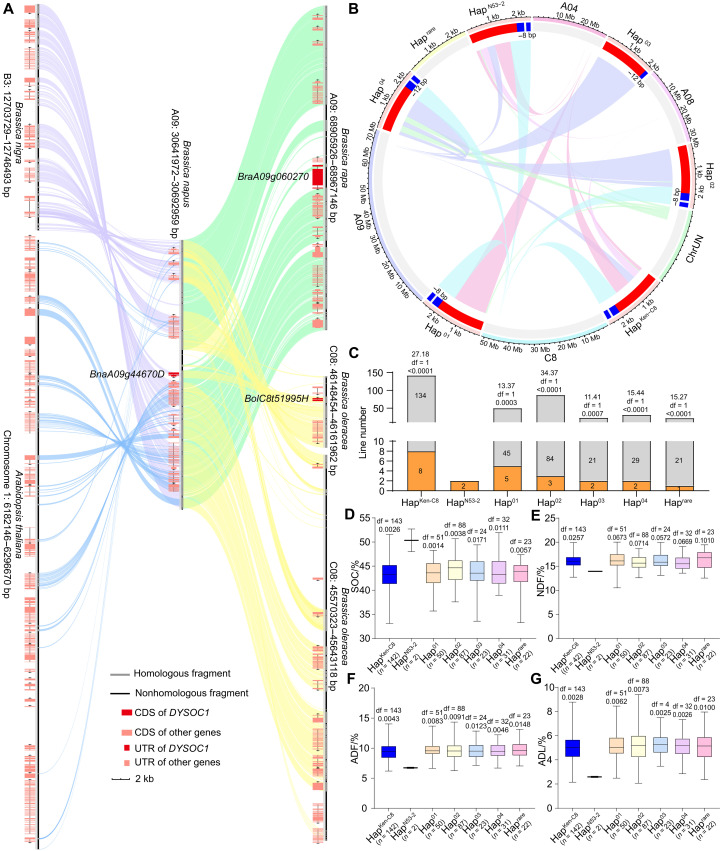
Fig. 6. The micro-synteny and haplotype analyses of DYSOC1.
(A) The micro-synteny of DYSOC1 and its 25-kb flanks with B. rapa, B. nigra, B. oleracea, and A. thaliana genome. The query sequence was homologous with the following regions: “A09: 68.91–68.97 Mb,” “B3: 12.70–12.75 Mb,” “C08: 45.57–45.64 Mb and 46.15–46.16 Mb,” and “chromosome 1: 6.18–6.30 Mb” of B. rapa, B. nigra, B. oleracea, and A. thaliana genome, respectively. The links indicate the best-aligned position of each query sequence segment relative to the refs. The name of DYSOC1 and its homology genes are annotated. UTR, untranslated region. (B) The variation among six BnaA09g44670D haplotypes (HapKen-C8, HapN53-2, and Hap01-04) and their formation through SVs. The links represent the best-aligned position of each haplotype sequence segment relative to the merged AACC genome. The red sections represent promoters, the blue sections represent exons, and the gaps between the blue sections represent introns. The length of Indels in the exons between HapKen-C8 and other haplotypes is also annotated. (C) The yellow SCC frequency of the different BnaA09g44670D haplotypes. The frequencies are annotated in the histograms, and the chi-square, df, and P value are annotated above the histogram (compared with HapN53-2, chi-square test). (D to G) The SOC (D), NDF (E), ADF (F), and ADL (G) variations of different BnaA09g44670D haplotypes in the B. napus natural population. The error bars represent the min and max values of each haplotype, and the top, middle, and bottom parallel lines represent the first, second, and third quartiles of each haplotype, respectively. The df and P values are annotated above histograms (compared with HapN53-2, two-tailed one-way ANOVA). In addition, the number of lines of each haplotype is annotated behind the x axis. Two replications were cultivated for each line, and the average trait value was adopted.

