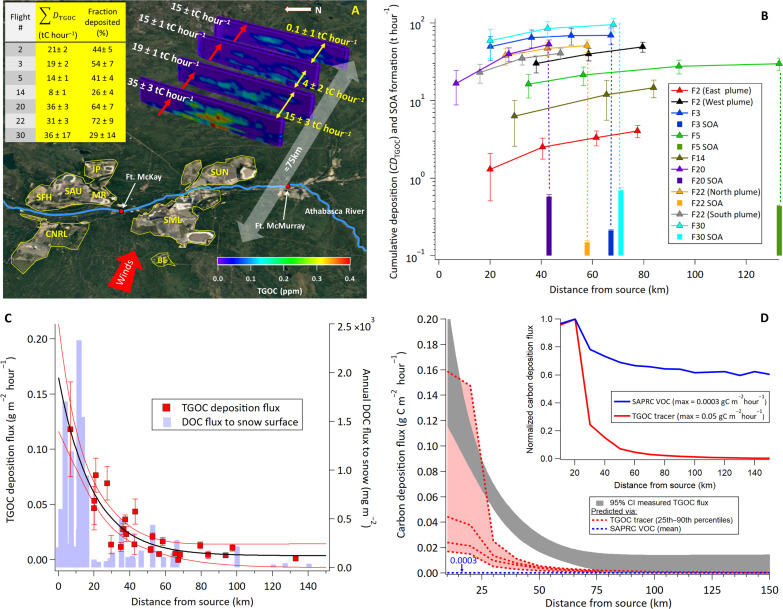
Fig. 1. Transport and deposition of measured and modeled TGOC.
(A) TGOC transfer rates (TTGOC; white values; tC hour−1) through the virtual screens of flight 3 downwind of oil sands surface mining operations, shown with differences between screens (yellow values). Inset: Sum of deposition rates between screens for all flights where the fraction deposited is relative to the transfer rate through the first screen. (B) Cumulative TGOC deposition rates ( markers) compared to cumulative SOA formation rates from available flights (bars) with dotted lines showing differences between deposition and SOA formation for the specific flight. (C) Measured under-plume TGOC deposition flux as a function of source distance across all flights, where distance from source is taken from the midpoint between screens. Red lines represent 95% confidence interval (CI) of an exponential fit to the data (black line). The measured flux decreases exponentially with distance, spatially consistent with the total measured DOC flux to snow (blue bars). (D) Simulated GEM-MACH carbon deposition using both the TGOC tracer approach and the SAPRC volatile organic carbon (VOC) method. Inset: GEM-MACH estimates of SAPRC VOC and TGOC tracer dry deposition normalized by their maximum values. The value of 0.0003 represents the maximum carbon deposition flux (grams per square meter per hour) predicted by GEM-MACH using the SAPRC VOC method described in the text.

