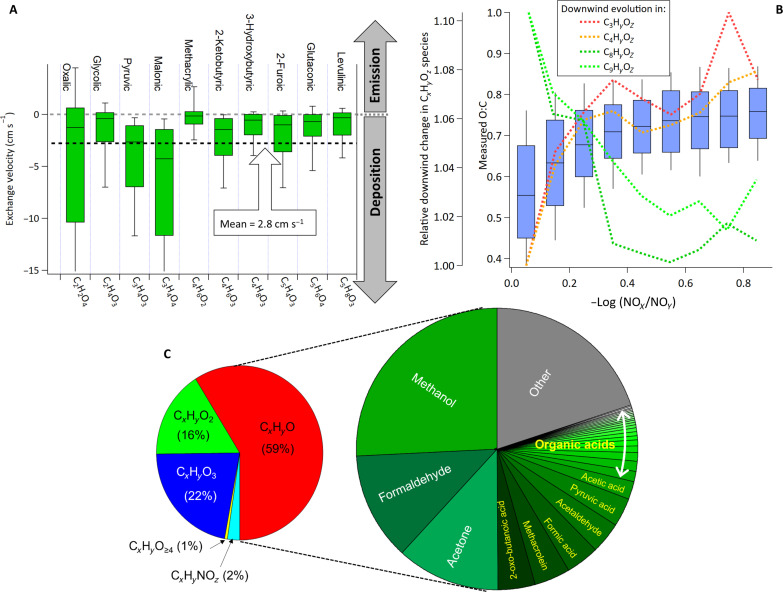
Fig. 2. Oxidized organic carbon speciation, evolution, and surface exchange.
(A) Net exchange velocities, including deposition and emissions/production, for select organic acids measured during a ground-based gradient flux study at 30 m over a tailing ponds in the oil sands region (see Materials and Methods). Negative values represent net deposition (i.e., deposition velocities). Dashed line represents the mean of ground-based observations (2.8 cm s−1) which are consistent with the overall TGOC Vd observed in aircraft data (3.3 cm s−1). (B) Average in-flight gas-phase O:C ratio for all detected species via proton-transfer and chemical ionization mass spectrometer measurements (see Supplementary Materials) as a function of photochemical age [i.e., −log(NOx/NOy)] for a representative flight in early spring (flight 2; blue bars representing quartiles). Dotted lines display changes in the relative downwind change in CxHyOz species (far left axis) normalized to the shortest photochemical age where a decrease in the C8-C9 normalized fraction and increase in the C3-C4 normalized fraction suggests multigenerational photochemistry/molecular fragmentation leading to smaller, more polar species available for deposition. (C) Mean (in-plume) relative contribution of different oxidized chemical families (left) during flight 20 and the breakdown of individual compounds for the top 30 species by mass (right), which is similar across all transformation flights.

