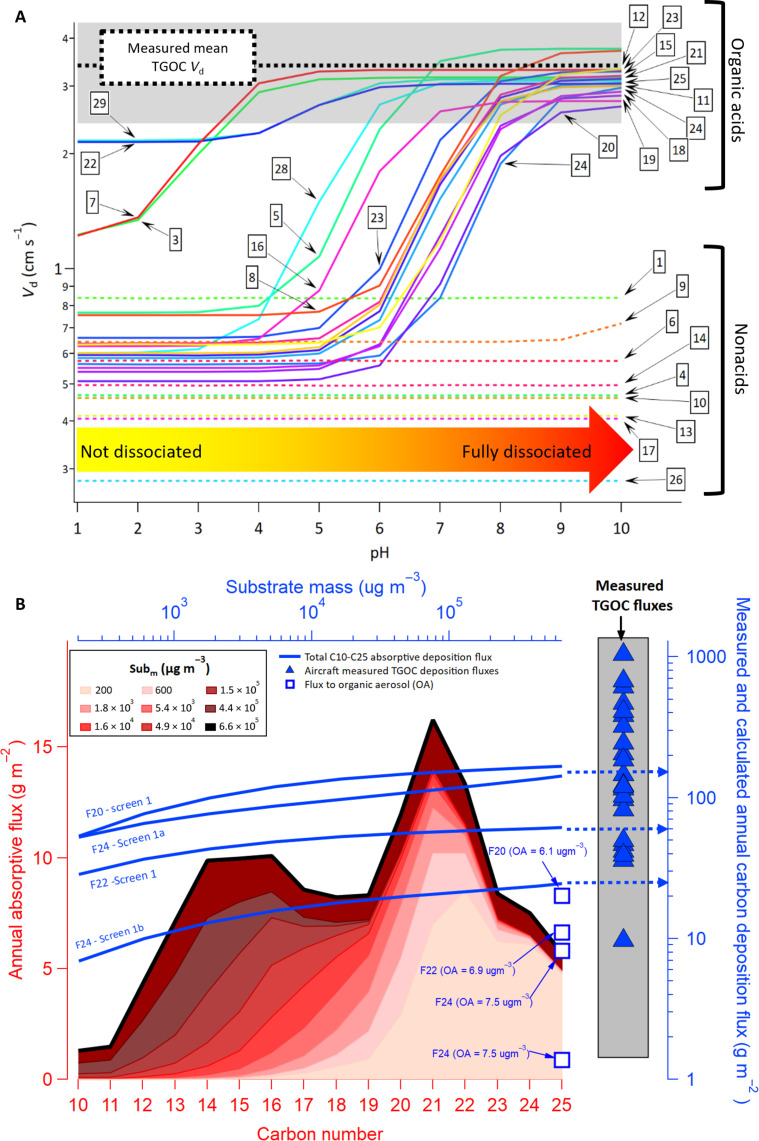
Fig. 3. Simulated deposition velocities and fluxes using traditional absorption and deposition theory.
(A) Monte Carlo simulations of deposition velocities (Vd; using a resistance model parametrization) for the top 30 organic species in Fig. 2C as a function of surface pH, under representative conditions for the region (mode value shown; see Supplementary Materials). Measured TGOC Vd (mean ± SD) is shown as a black dashed line and gray shading, and number labels indicate the individual species in table S2, which make up only a small fraction of the measured TGOC. (B) Estimated annual absorptive deposition fluxes for observed IVOCs-SVOCs (flight 20, screen 1) as a function of carbon number and increasing forest substrate mass (Subm) where darker shaded red areas indicate larger substrate mass available for absorptive partitioning (see Supplementary Materials). The calculated deposition flux total for >C10 species (blue lines) is also shown for several flights as a function of forest substrate mass (top axis) and compared to the measured TGOC deposition fluxes across all flights (blue triangles) and shown with the flux to OA during flights (blue squares).

