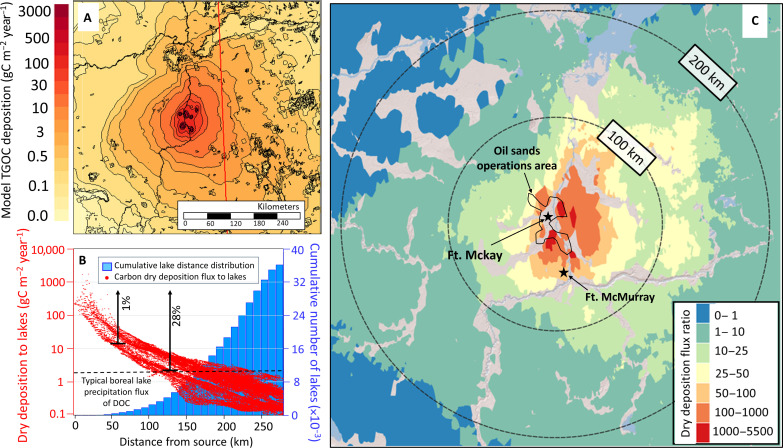
Fig. 5. Determining the impact of TGOC deposition on freshwater lakes in the region.
(A) Model estimated annual dry deposition carbon flux based on the GEM-MACH TGOC approach (see Materials and Methods and SI) near oil sands sources, with circles radiating outward from Fort McKay. (B) Cumulative histogram of distance from oil sands source(s) to the >36,000 lakes within 275 km of Fort McKay (blue bars), and the GEM-MACH estimated TGOC dry deposition flux for the grid cells containing those lakes (red data points). Percentages (1 and 28%) denote the fraction of lakes which receive TGOC deposition fluxes greater than 20 and 2 gC m−2 year−1, respectively. (C) Dry deposition flux ratio (DDFR = Dry deposition flux / lake catchment DOC flux) (see main text), as a measure of the contribution of atmospheric organic carbon to the overall catchment DOC balance.

