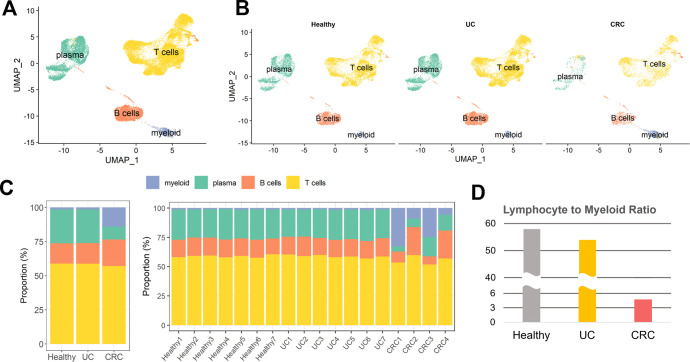
Fig 1. Overview of the scRNA-seq profiles of immune cells from healthy controls, UC, and CRC patients.
(A) UMAP plot of annotated cell types. Myeloid, T, B, and plasma cells were identified. (B) UMAP visualization split by disease status. (C) Stacked bar plot of immune cell proportions. The proportions for each group are shown in the left panel, and those for each individual are shown in the right panel. (D) Lymphocyte-to-myeloid ratio according to disease status.

