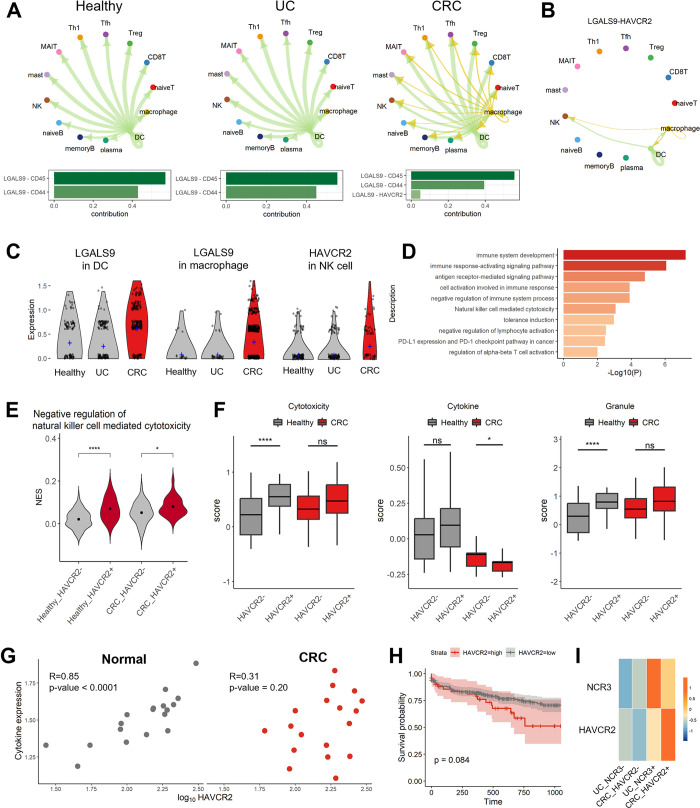
Fig 5. CRC-specific intercellular signaling pathways.
(A) The GALECTIN pathway according to disease condition. Each immune cell type is assigned the color of a circle, and the color of the arrow is the same as the color of the cell type sending the signal. (B) Circle plot of the interaction between the LGALS9-HAVCR2 pair and the GALECTIN pathway in healthy donors, UC patients, and CRC patients. (C) Gene expression levels of a ligand and a receptor in the GALECTIN pathway. The violin plot shows the expression levels of the ligand LGALS9 in DCs and macrophages and the receptor HAVCR2 in NK cells. The crossbar indicates the average expression level of transcripts in each status. (D) Immunological functions of differentially coexpressed genes in HAVCR2+ NK cells compared to HAVCR2- NK cells in the CRC group. To determine the significance of the differences, the Wilcoxon test was performed; p ≤ 0.05 (*), p ≤ 0.01 (**), p ≤ 0.001 (***), p ≤ 0.0001 (****), and not significant (ns). (E) Violin plot of NES for negative regulation of natural killer cell-mediated cytotoxicity. The groups were separated based on disease condition and the expression of HAVCR2. (F) Boxplot of cytotoxicity in NK cells separated according to HAVCR2 expression. As shown in Fig 4G, groups were separated by the presence (+) or absence (-) of HAVCR2 expression in healthy individuals and CRC patients. (G) Correlation between HAVCR2 and cytokine expression levels. The correlation coefficients and p-values are displayed in the upper left. (H) Kaplan-Meier survival plot for 3 years. The 371 CRC patients from TCGA-COAD are classified based on the expression levels of HAVCR2, and survival plot is described in days. (I) The expression level of NCR3 and HAVCR2 in NK cells of UC and CRC patients. The groups are categorized based on the expression levels of NCR3 and HAVCR2 with disease.

