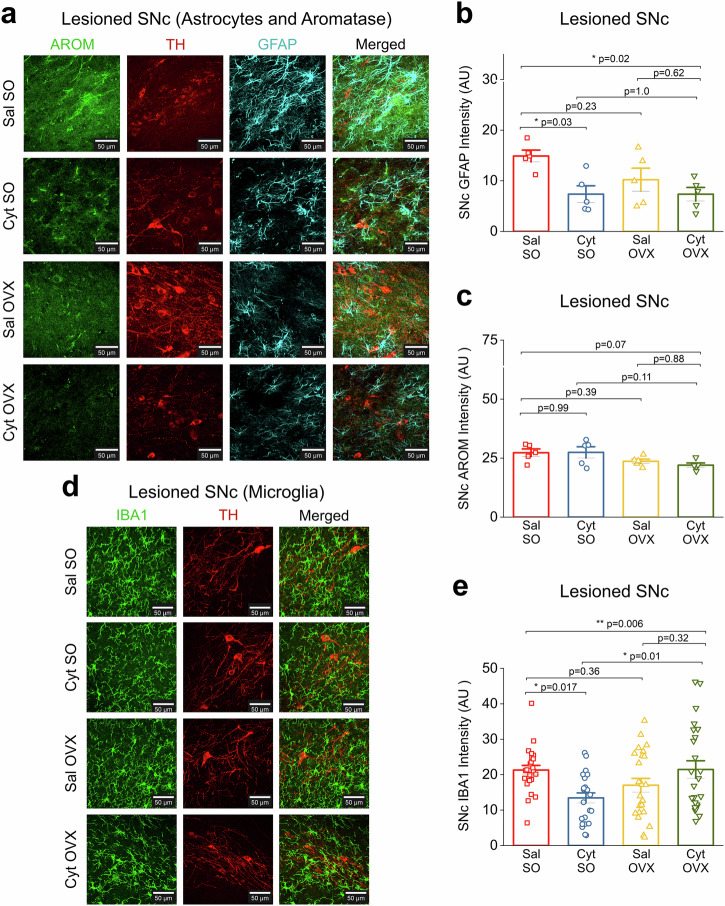
Fig. 3. Cytisine neuroprotection in OVX mice is independent of glial derived estrogen.
a Representative confocal images from the lesioned SNc across treatment groups for AROM and GFAP immunostaining. All sections were stained for AROM (green), TH (red), and GFAP (cyan). Scale bar = 25 µm. b Bar graph comparing total GFAP intensity in the lesioned SNc for all treatment groups c Bar graph comparing total AROM intensity in the lesioned SNc for all treatment groups. d Representative confocal images from the lesioned SNc across treatment groups for IBA1 immunostaining. All sections were stained for IBA1 (green) and TH (red). Scale bar = 25 µm. e Bar graph comparing IBA1 intensity in the lesioned SNc for all treatment groups. Each data point is the average of either GFAP, AROM, or IBA1 intensity measured from 4 images for the lesioned SNc. Error bars are S.E.M. p values are derived from a one-way ANOVA and Tukey post hoc comparisons between treatment groups. For GFAP and AROM staining, n = 5 for each group. For IBA1 staining, n = 4 for each group.

