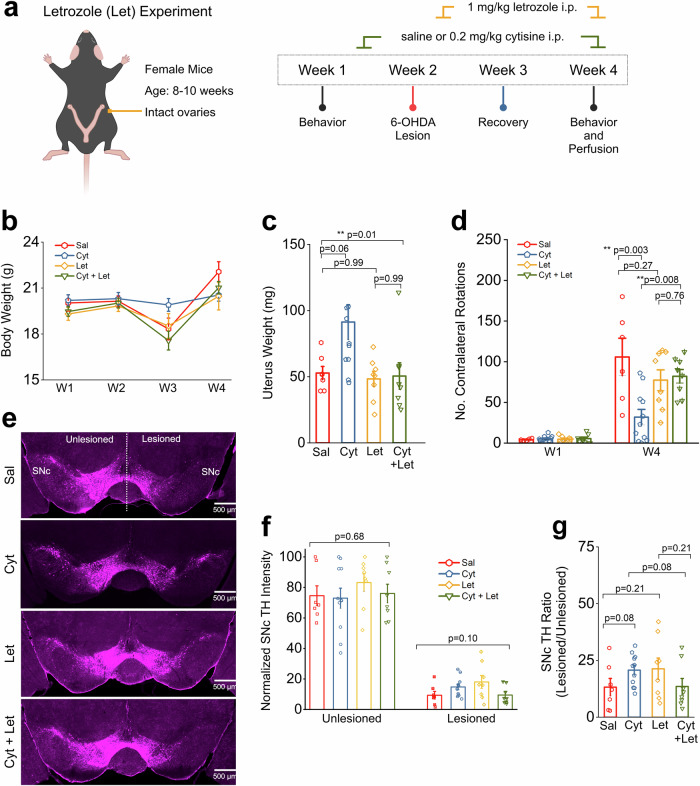
Fig. 4. Cytisine neuroprotection is reversed by aromatase inhibition.
a Schematic of protocol for behavior assays. b Comparison of body weight changes across the experiment timeline for each treatment group. c Comparison of uterine weights collected at the end of the experiment. d Bar graph showing the number of contralateral rotations counted in 15 min after i.p. injection with 0.5 mg/kg apomorphine for weeks 1 and 4. e Representative images of a single midbrain section from each treatment group. Scale bar = 500 µm (f) Bar graphs comparing total TH intensity in either the unlesioned or lesioned SNc for all treatment groups. Each data point is the sum of TH intensity measured for either the unlesioned or lesioned SNc in 8 images per mouse. g Bar graphs comparing TH intensity ratios for all treatment groups. Error bars are S.E.M. For panel c, the p values were derived from a one-way ANOVA test for all treatment groups. For panels d and g, the p values are based on two-sample t-tests. For panel f, the p values are derived from a one-way ANOVA comparing each treatment group in the unlesioned or lesioned SNc. n = 7 saline mice, n = 7 cytisine mice, n = 8 letrozole mice (let), and n = 8 cytisine + letrozole mice (cyt+let).

