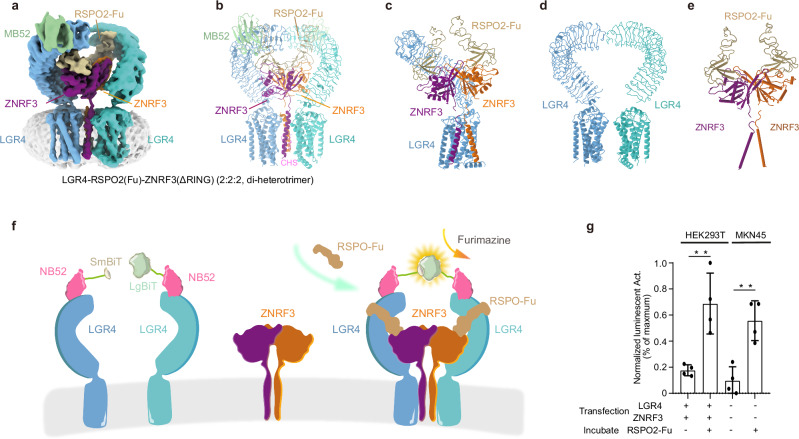
Fig. 1. Cryo-EM structure of LGR4-RSPO2-ZNRF3(ΔRING) (2:2:2, di-heterotrimer) complex.
Structure of LGR4-RSPO2-ZNRF3(ΔRING) (2:2:2, di-heterotrimer) complex, Cryo-EM map (a) and atomic model (b) are shown. c The model of the di-heterotrimer complex (one LGR4 is omitted for clarity). d The arrangements of two LGR4 protomers in di-heterotrimer are shown from the front view. e The arrangements of RSPO2and ZNRF3 subunits are shown from the front view. Subunits LGR4, ZNRF3, and RSPO2 are colored in light blue/cyan, violet/orange, and brown, respectively. The nanobody portion of MB52 is shown in slate green (other segment is omitted for clarity). The same color scheme is used throughout the manuscript unless stated otherwise. f Schematic of the NanoBiT cell-based assay. The structure shows the proximity of two NB52s (pink). LgBiT (large subunit, light green) and SmBiT (small subunit, light brown) fragments are fused to the C-terminus of two NB52, respectively. The assembly of LGR4-RSPO2-ZNRF3(2:2:2) complex in the schematic (colored identically as in panel a) facilitates the luminescence complementation of NB52-LgBiT and NB52-SmBiT. g The results demonstrate a strong luminescent signal when RSPO2, NB52-LgBiT, and NB52-SmBiT, along with furimazine, are added to 293T cells (p = 0.005, n = 4) or MKN45 cancer cells (p = 0.0026, n = 4) expressing LGR4 and ZNRF3. Each value represents the mean ± SEM from four independent experiments. Source data are provided as a Source Data file.

