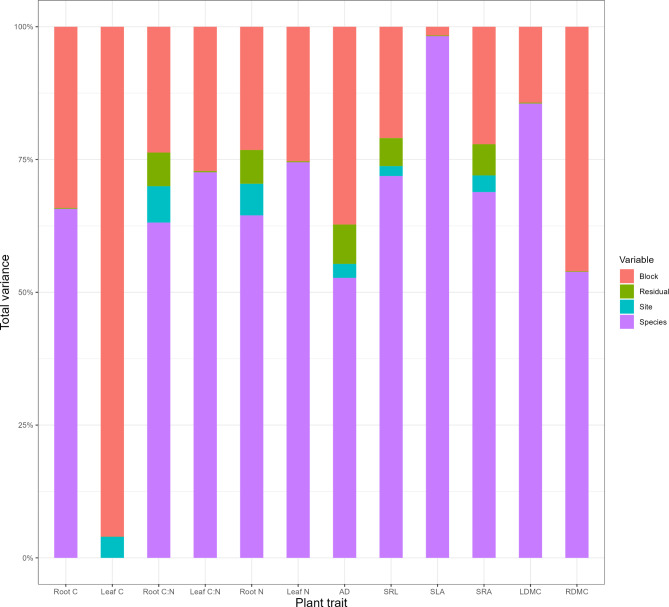
Fig. 5.
Variance decomposition for each trait across all tree species. Bars are the total trait variation for each plant trait. The sub-bars shows the percentage of the total variation for each trait explained by species (purple), site (blue), variation between blocks within a site (peach) and residual variation (green). The fourteen plant traits are root carbon content (Root C); leaf carbon content (Leaf C); root carbon to nitrogen ratio (Root C: N); leaf carbon to nitrogen ratio (Leaf C: N); root nitrogen content (Root N); leaf nitrogen content (Leaf N); average fine root diameter (AD); specific leaf area (SLA); specific root length (SRL); specific root area (SRA); leaf dry matter content (LDMC), and root dry matter content (RDMC).

