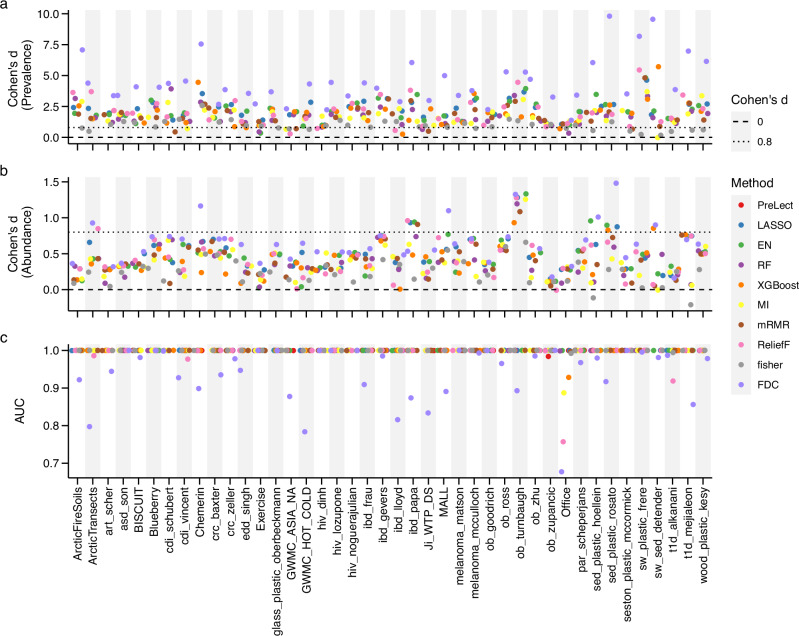
Fig. 4. Comparative analysis of PreLect with ML-based methods across 42 microbiome datasets in the ‘equivalent size model’.
a and b Effect size of prevalence and abundance difference. Cohen’s d measures the effect size of the prevalence difference between PreLect and other benchmarked machine learning methods. Values above 0.8 (dotted line) indicate a notable higher feature prevalence or abundance of PreLect. c Classification performance. The AUC values are derived from a naïve logistic regression model to classify case and control samples. Herein, all the ML-based methods use the top n weighted features. n equals the number of features selected by PreLect. The prediction performance of all benchmarking methods was assessed using logistic regression, employing a 7/3 train-test split ratio. The evaluation was conducted on the testing set to ensure the accuracy and reliability of the results.

