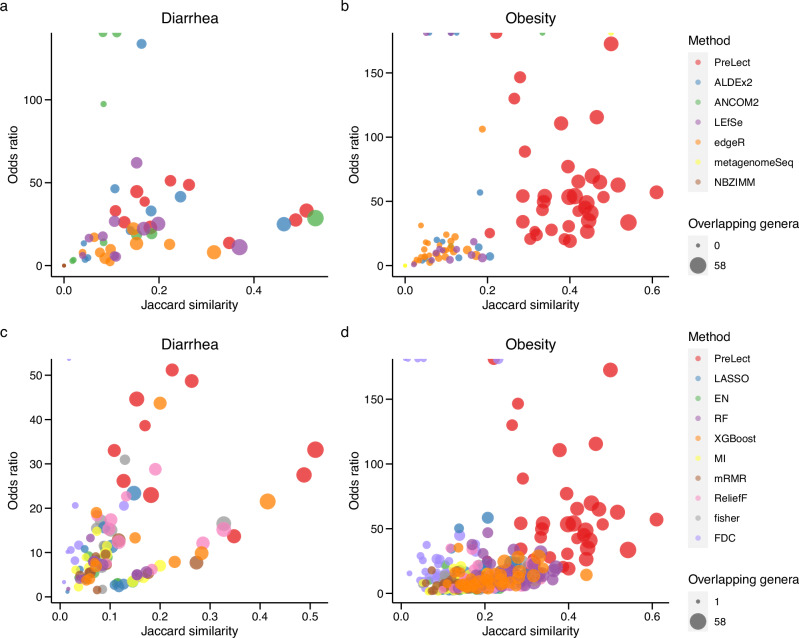
Fig. 5. Genera selection consistency across cohorts for diarrhea and obesity.
a and b Comparison with statistical methods. c and d Comparison with ML-based methods. The results derived from ML-based methods are in the ‘equivalent size model.’ The x-axis shows Jaccard similarity, which measures the similarity of shared genera; the y-axis shows the odds ratio that indicates the strength of association between selected genera and the condition (diarrhea or obesity). The size of data points reflects the number of shared genera, and color represents the feature selection method.

