Fig. 1.
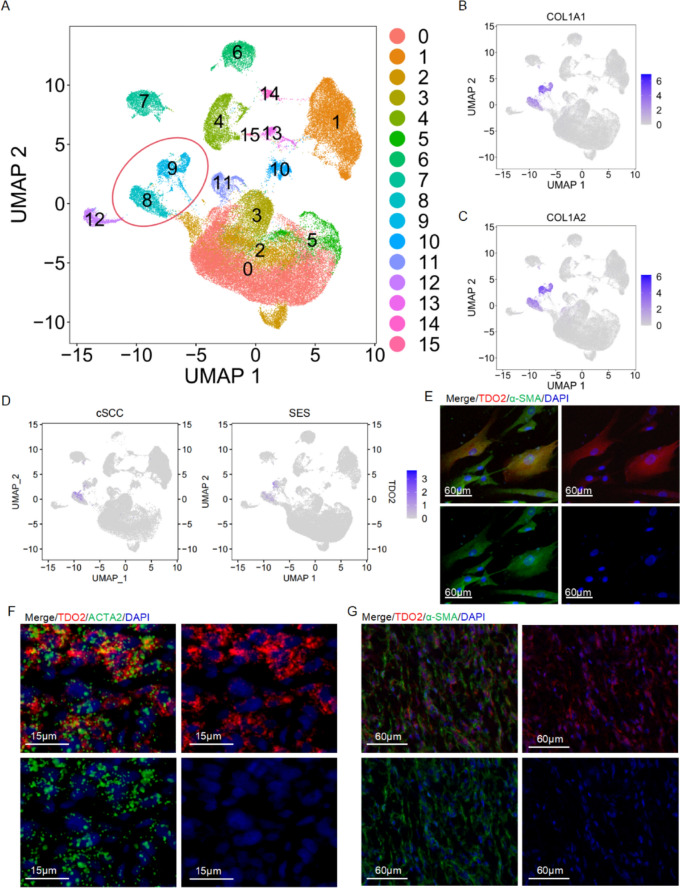
Analysis of TDO2 expression in CAFs of cSCC. A UMAP projection visualizes the clustering of cell populations in cSCC, with each color representing a distinct cell subgroup, identifying a total of 15 subgroups. B UMAP plots illustrate the expression of the gene COL1A1 within cells from cSCC, with color intensity reflecting expression levels. C Similar to B, these UMAP plots display the expression of the gene COL1A2. D UMAP visualization of TDO2 expression across the cell populations, showing localized upregulation. E Immunofluorescence images demonstrating the co-localization of TDO2 (red) with α-SMA (green) in isolated CAFs, confirming their concurrent overexpression; the scale bar denotes 60 μm. F-G In situ hybridization and immunofluorescence staining of cSCC tissues showing the colocalization of TDO2 (red) with ACTA2/α-SMA (green). DAPI (blue) marks the nuclei. Scale bars represent 15 μm (Fig. 1F) and 60 μm (Fig. 1G)

