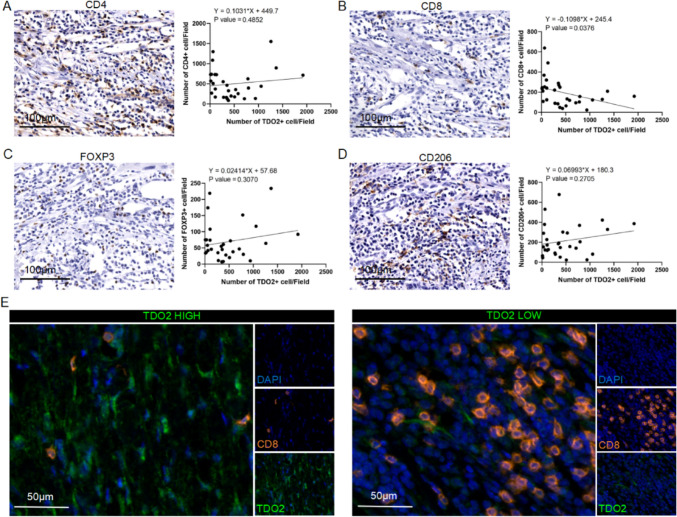
Fig. 2.
Correlation between TDO2 expression and CD8 + T cell infiltration in cSCC patients. A-D Immunohistochemical analysis of the correlation between TDO2 + cells and CD4 + T cells, CD8 + T cells, FOXP3 + cells, and CD206 + cells. The figure displays scatter plots and regression analysis demonstrating the correlation between the quantity of TDO2 + cells and the numbers of CD4 + T cells, CD8 + T cells, FOXP3 + cells, and CD206 + cells. The linear regression equation and P-value adjacent to the scatter plots indicate a significant negative correlation between the number of TDO2 + cells and CD8 + T cells, while the correlation with other immune cell markers is not significant. Scale bar = 100 µm. E Representative mIHC images of TDO2 + cells and CD8 + T cells. The image shows the expression of TDO2 (green) and CD8 (orange) via immunofluorescence staining in cSCC patient tissue samples. The left image represents an area of high TDO2 expression, while the right image represents an area of low TDO2 expression. DAPI (blue) is used for nuclear staining. Scale bar = 50 µm. Statistical significance is indicated as *p < 0.05

