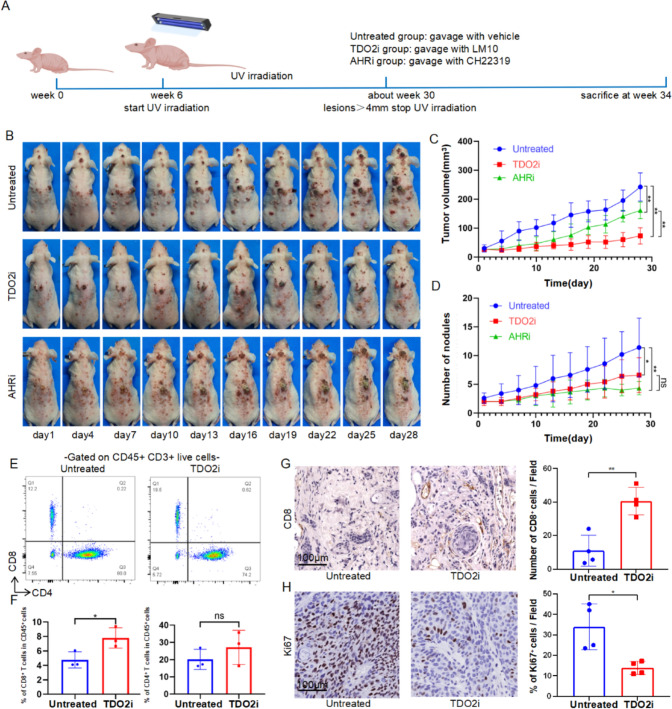
Fig. 3.
Intervention of TDO2 inhibits tumor growth in mice. A Timeline for mouse model establishment and drug intervention. B Representative schematic of tumor development in mice from the untreated group, the TDO2i group, and the AHRi group. C Curves showing changes in tumor volume over time in different treatment groups (n = 5/group). D Statistical analysis of the number of tumors over time in different treatment groups (n = 5/group). E Flow cytometry analysis of immune cell infiltration. Representative flow cytometry scatter plots showing CD4 + T cells and CD8 + T cells expression in CD45 + CD3 + live cells from mice in the untreated group and the TDO2i group. F The left graph shows the percentage of CD8 + T cells within CD45 + cells, indicating a significant increase in the proportion of CD8 + T cells in the TDO2i group; the right graph shows the percentage of CD4 + T cells within CD45 + cells, with no significant difference observed (n = 3/group). G Immunohistochemical staining for CD8 + T cells, showing the comparison of the number of CD8 + T cells in tumor tissues between the untreated group and the TDO2i group (n = 4/group). H Immunohistochemical staining for Ki67, showing the comparison of the proportion of Ki67 + cells in tumor tissues between the untreated group and the TDO2i group (n = 4/group). Scale bar = 100 μm. The data are presented as mean ± SEM. Statistical significance is indicated as ∗ p < 0.05, ∗ ∗ p < 0.01

