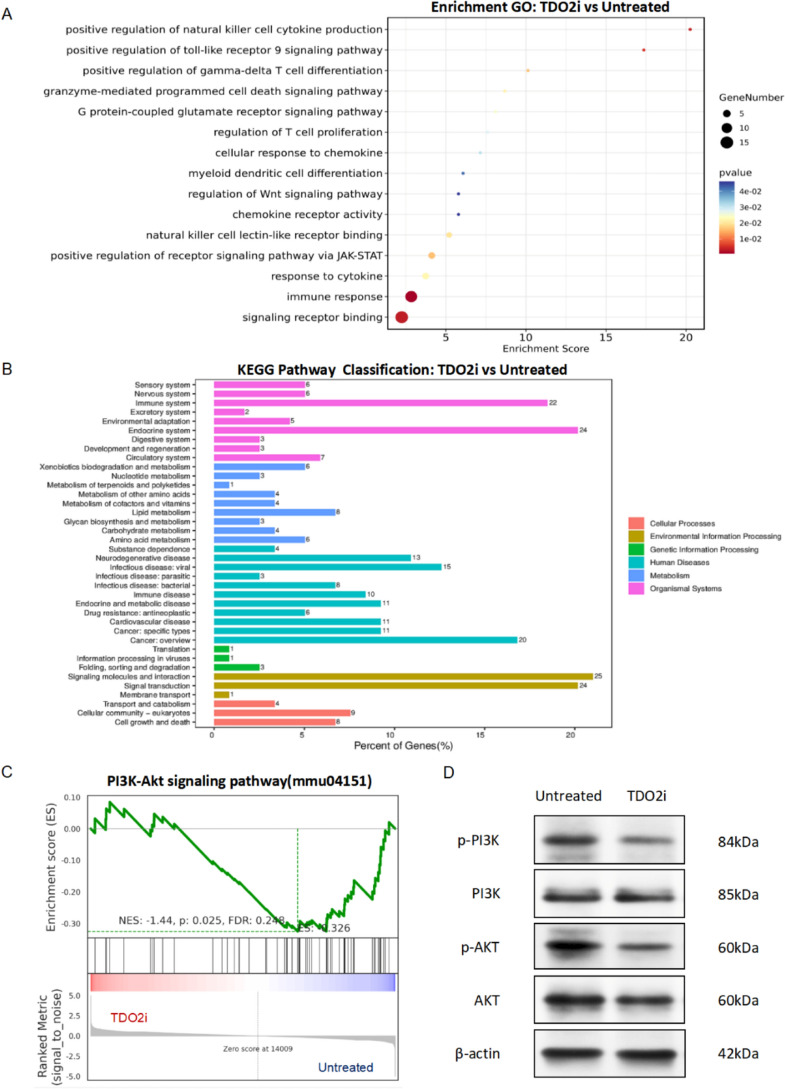
Fig. 4.
TDO2 inhibitors suppress tumor progression by modulating immune cell functions. A GO functional annotation chart for the untreated group and the TDO2i group. The figure displays the results of GO functional enrichment analysis, highlighting the key biological processes affected by TDO2 inhibitors, the analysis compares the untreated group and the TDO2i group. The size of the dots represents the number of genes involved in each process, while the gradient of color indicates the significance of the P-values, ranging from blue (least significant) to red (most significant). B KEGG pathway annotation chart for untreated group and TDO2i group. The bar graph displays the pathways most significantly affected according to KEGG pathway enrichment analysis. This analysis also compares the untreated group and the TDO2i groups, illustrating pathways predominantly influenced by the treatment with TDO2 inhibitors. The length of each bar represents the percentage of genes involved, while the color denotes different categories of biological processes. C GSEA functional enrichment analysis chart for the untreated group and the TDO2i group. These line graphs represent the enrichment of the PI3K-Akt signaling pathway based on GSEA. n = 4/group. The Normalized Enrichment Score (NES), p-value, and False Discovery Rate (FDR) provide statistical significance of the enrichment for each set. D Western blot analysis of the expression of p-PI3K, PI3K, p-AKT, and AKT in untreated and TDO2i groups. β-actin served as an internal control

