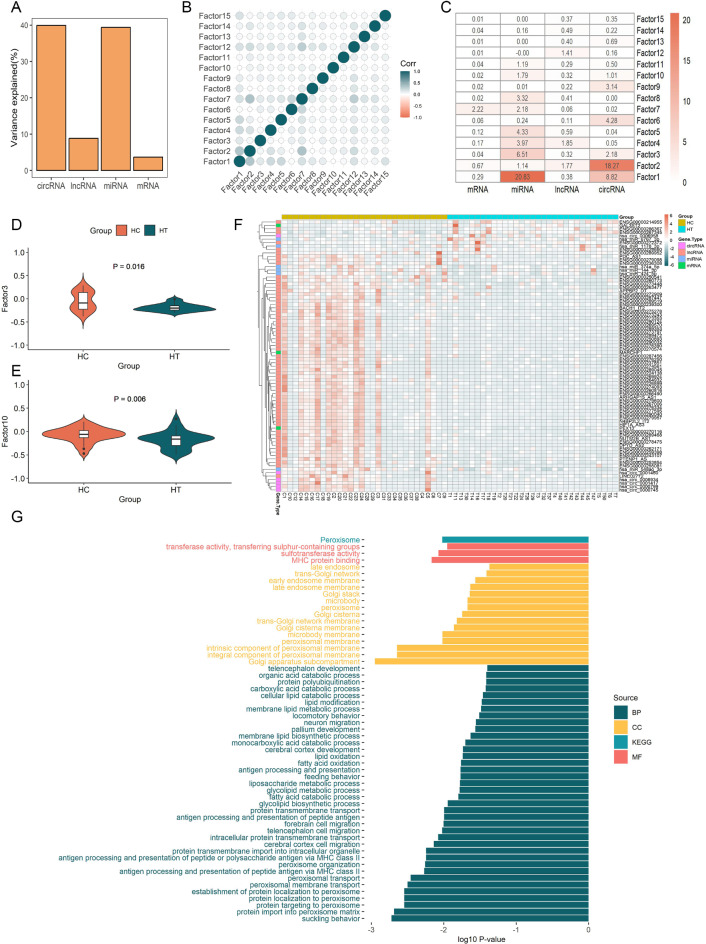
Fig. 2.
Multi-omic factor analysis of RNA signatures in Hashimoto’s thyroiditis. (A) Bar plot demonstrating the total variance explanation of the model for the four RNA-seq datasets. (B) Heatmap representing the correlation between factors. (C) Heatmap displaying the variance explanation for each factor across the four RNA types. (D, E) Violin plots indicating the values of Factor 3 and Factor 10 across Hashimoto’s thyroiditis and healthy control samples. (F) Expression heatmap visualizing the characteristic RNA signatures identified through multi-omic factor analysis. (G) Bar plot presenting the results of GO and KEGG enrichment analysis for the mRNAs included in the characteristic RNA signatures. ENSEMBL IDs are shown only for transcripts without officially assigned gene symbols, primarily novel lncRNAs; all other transcripts are displayed using their HGNC gene symbols.

