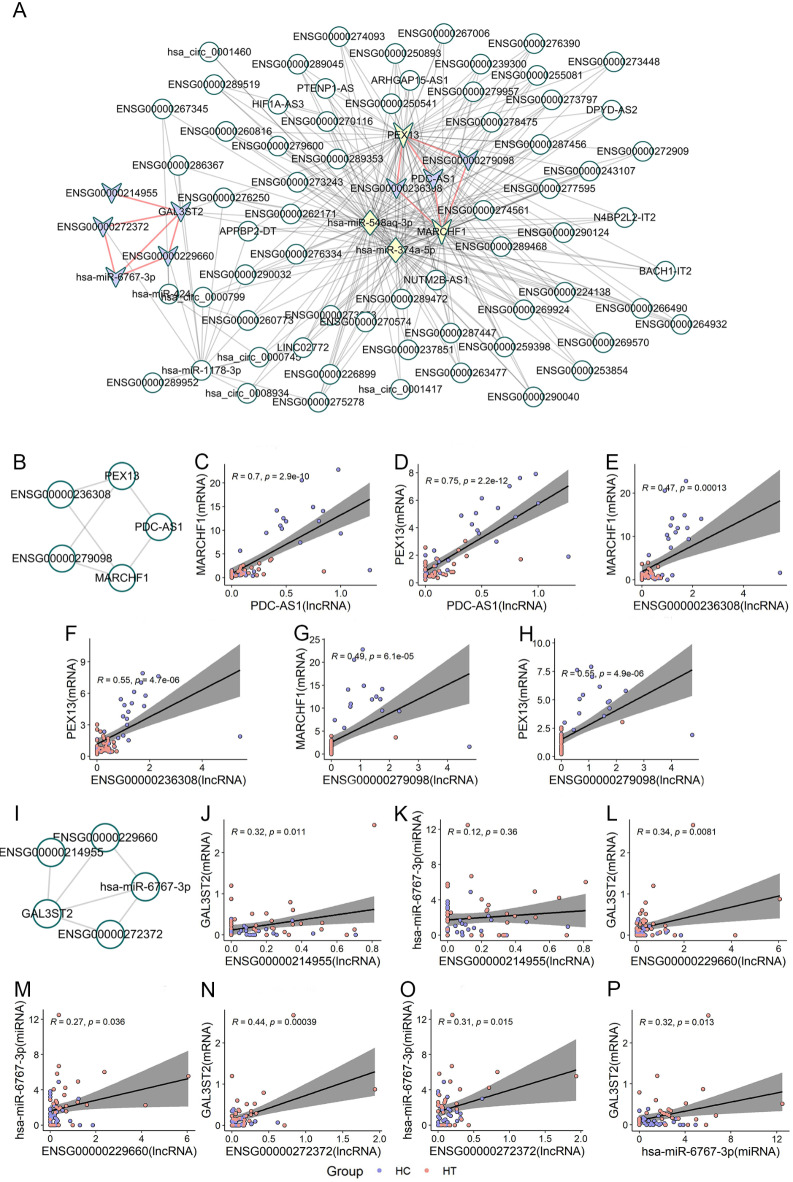
Fig. 3.
Results of co-expression network analysis in Hashimoto’s thyroiditis. (A) Visualization of the co-expression network. The yellow nodes represent hub genes, “V”-shaped nodes indicate modules, and lines between nodes represent interactions. (B) Visualization of Module 1. This module consisted of 5 RNA signatures (MARCHF1, PDC-AS1, ENSG00000236308, ENSG00000279098, PEX13). (C–H) Expression correlation plots for molecular pairs within Module 1. Red points represent the HT group, purple points represent the healthy control group, the black line indicates the fitted line, and the gray interval represents the confidence interval. (I) Visualization of Module 2. This module comprised 5 RNA signatures (ENSG00000272372, GAL3ST2, hsa-miR-6767-3p, ENSG00000214955, ENSG00000229660). (J–P) Expression correlation plots for molecular pairs within Module 2. Red points represent the HT group, purple points represent the healthy control group, the black line indicates the fitted line, and the gray interval represents the confidence interval. ENSEMBL IDs are shown only for transcripts without officially assigned gene symbols, primarily novel lncRNAs; all other transcripts are displayed using their HGNC gene symbols.

