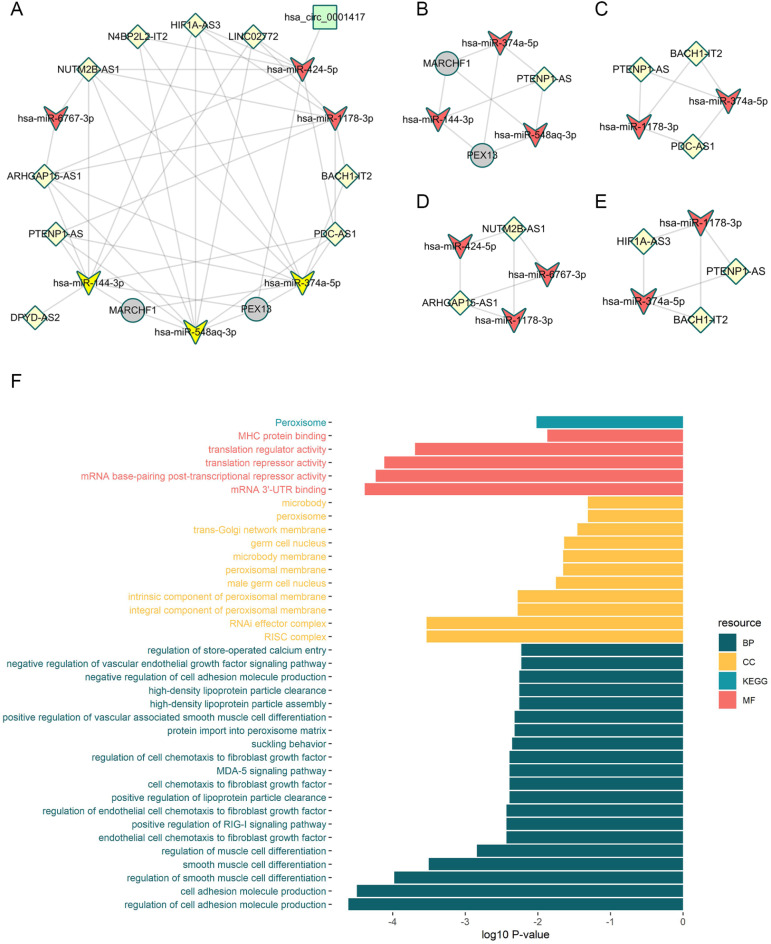
Fig. 4.
Regulatory network analysis of RNA signatures in Hashimoto’s thyroiditis. (A) Visualization of the regulatory network. Gray circular nodes represent mRNAs, red “V”-shaped nodes represent miRNAs, yellow diamond-shaped nodes represent lncRNAs, and green square nodes represent circRNAs. (B–F) Visualization of four modules within the regulatory network, highlighting potential functional RNA signature clusters. (G) Bar plot presenting the results of GO and KEGG enrichment analysis for the regulatory network, providing insights into the biological processes and pathways associated with the identified RNA signatures.

