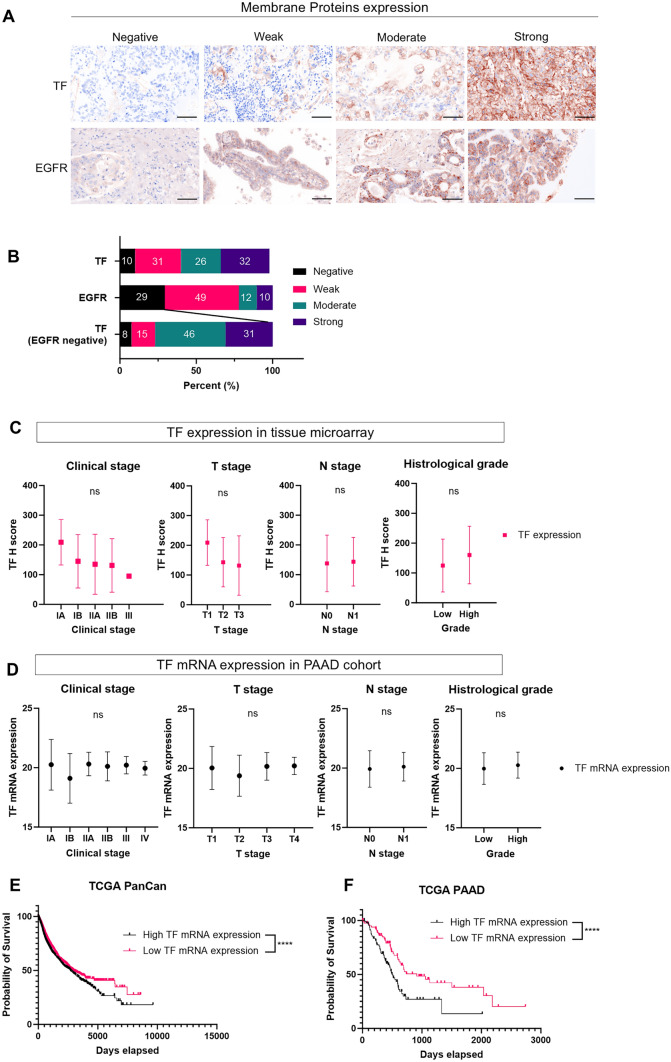
Fig. 1.
TF expression in tissue microarray and TCGA cohort. A and B, Immunohistochemical evaluation of membrane TF and EFGR expression in pancreatic cancer tissue microarray specimens. Both TF and EGFR H-scores were calculated based on membrane TF and EGFR expression. The staining was classified into one of four groups: negative (H-score 0–14), weak (H-score 15–99), moderate (H-score 100–199), and strong (H-score 200–300). A, Representative images are shown (images, × 200; scale bar, 100 μm). Antibody staining of TF or EGFR is shown in brown. Nuclei are stained with DAPI and shown in blue. B, Distribution of TF and EGFR staining category in 68 pancreatic cancer cases. C and D, Comparison of TF protein expression (H-score) and TF mRNA expression among the clinical stage, T stage, N stage, and tumor grading in tissue microarray [n = 68] or public clinical cohorts of pancreatic cancer [PAAD; TCGA 2019 (n = 182)]. G1 or G2 was defined as low-grade histology, and G3 or G4 was defined as high-grade histology. Mean and SD are shown as solid and dashed lines, respectively. ns, not significant (Clinical stage and T stage, one-way ANOVA followed by Tukey's test. N stage and histological grade, Mann Whitney U test). E and F, Kaplan–Meier overall survival curves of pan-cancer or pancreatic cancer patients according to TF mRNA expression in TCGA PanCan (n = 11,506) or TCGA PAAD dataset (n = 181). ****, p < 0.0001

