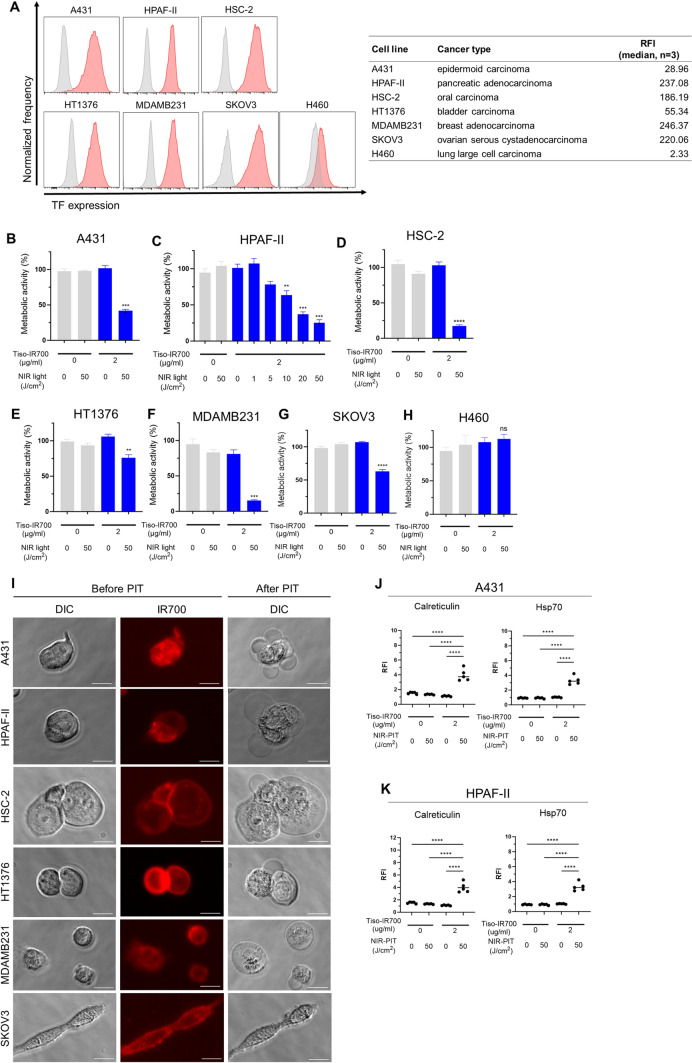
Fig. 2.
In vitro TF expression and efficacy of TF-targeted NIR-PIT in each cancer cell line. A, Flow cytometric analysis of in vitro TF expression on the cell surface of each cancer cell line. The relative fluorescence intensity (RFI) of TF for each cell line (n = 3; median) is shown in the right side table. RFI was calculated as the ratio of the median fluorescence intensity of anti-TF antibody to that of the isotype control. B–H, Metabolic activity of A431 (B), HPAF-II (C), HSC-2 (D), HT1376-luc (E), MDAMB231 (F), SKOV3-luc (G), and H460 (H) cells after in vitro TF-targeted NIR-PIT was measured by MTT assay (n = 4; one-way ANOVA followed by Tukey’s test). *, p < 0.05; **, p < 0.01; ***, p < 0.001; ****, p < 0.0001; ns, not significant vs. untreated control. I, Microscopic observation of cancer cells before and after in vitro NIR-PIT using tiso-IR700 (images, × 400; scale bar, 20 μm). DIC, differential interference contrast. J and K, Expression of calreticulin and Hsp70 after TF-targeted NIR-PIT in A431 (J) and HPAF-II (K). ****, p < 0.0001

