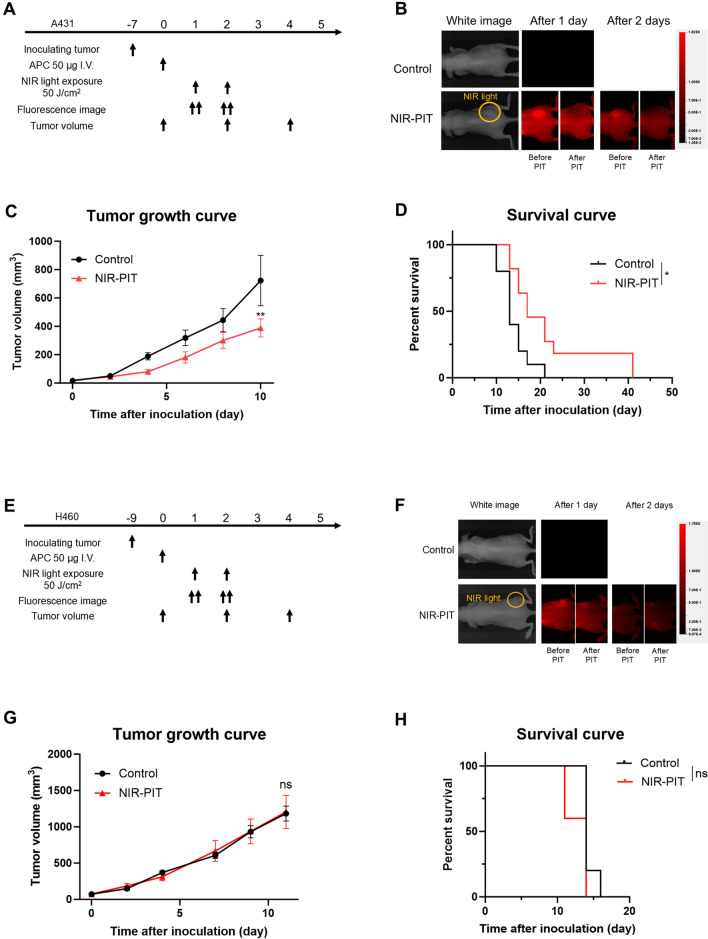
Fig. 4.
Efficacy of in vivo TF-targeted NIR-PIT in the A431 (A-D) and H460 (E-H) subcutaneous xenograft model. A, Treatment schedule of A431 model. B, Representative 700-nm fluorescence images before and after NIR-PIT. C, Tumor volume curves (n = 10; mean ± SEM; repeated measures two-way repeated measures ANOVA followed by Sidak's test); **, p < 0.01 versus the control group. D, Survival curves (n = 10, log-rank test); *, p < 0.05. E, Treatment schedule of H460 model. F, Representative 700-nm fluorescence images before and after NIR-PIT. G, Tumor volume curves (n = 10; mean ± SEM; repeated measures two-way repeated measures ANOVA followed by Sidak's test); ns, not significant versus the control group. H, Survival curves (n = 10, log-rank test); ns, not significant

