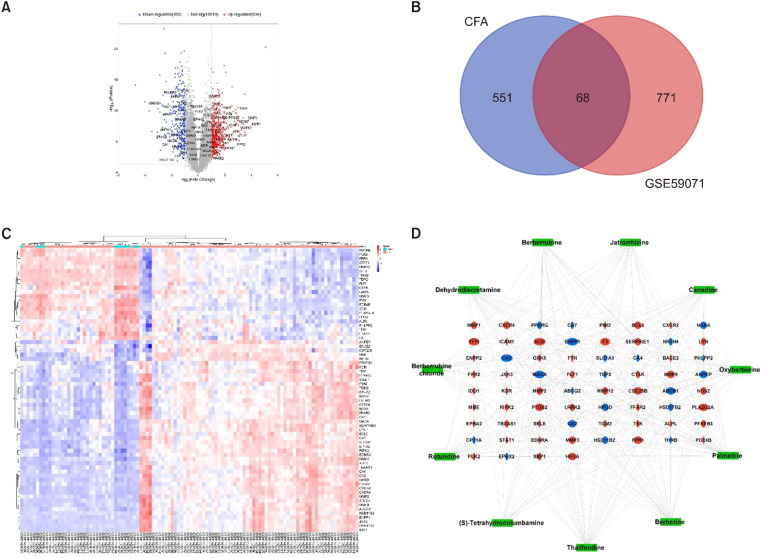
Fig. 3.
Screening of CFA-UC common targets. (A) Volcano plot of gene expression data (GSE59071). Red and blue indicate upregulated genes (logFC ≥1) and downregulated genes (logFC ≤—1), respectively, whereas those in gray show no significant difference. (B) Venn diagram of the intersection of potential targets of CFA and DEGs in UC-related genes in the GSE59071 dataset. (C) The heatmap represents the 68 genes in UC-related to dataset GSE59071. Red and blue indicate up- and downregulated genes, respectively. Among them, UC tissues expressed 41 up- and 21 downregulated genes. (D) CFA active compound-disease-target network. The 68 common targets are represented by red ellipses for upregulated genes and blue ellipses for downregulated genes. The green square nodes indicate the 11 alkaloid compounds. CFA, Coscinium fenestratum alkaloid; UC, ulcerative colitis; DEGs, differentially expressed genes.

