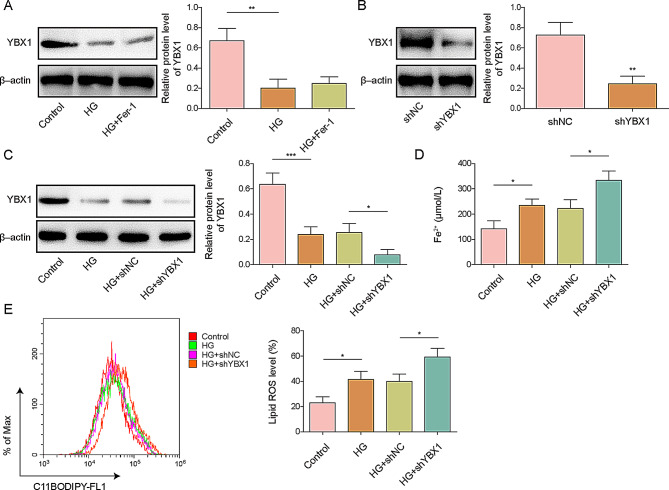
Fig. 3.
Effect of YBX1 in MC3T3-E1 cells on ferroptosis. MC3T3-E1 cells were used to construct an in vitro osteoporosis model by treating them with D-galactose (25.5 mM) or without (control). The cells were additionally treated with Ferrostatin-1 (Fer-1). (A) YBX1 protein expression levels and quantification in high-glucose (HG)-treated MC3T3-E1 cells with or without Fer-1 treatment were assessed. (B) YBX1 protein expression levels and quantification in shYBX1- or shNC-transfected MC3T3-E1 cells. (C) YBX1 protein expression and quantification in shYBX1- and shNC-transfected HG-induced MC3T3-E1 cells. (D) Cellular Fe2+ concentrations in shYBX1- or shNC-transfected HG-induced MC3T3-E1 cells. (E) Lipid ROS levels in shYBX1- and shNC-transfected HG-induced MC3T3-E1 cells. n = 3. Data are shown as mean ± SD. * P < 0.05, ** P < 0.01, and *** P < 0.001. ROS, reactive oxygen species; YBX1, Y-box binding protein 1

