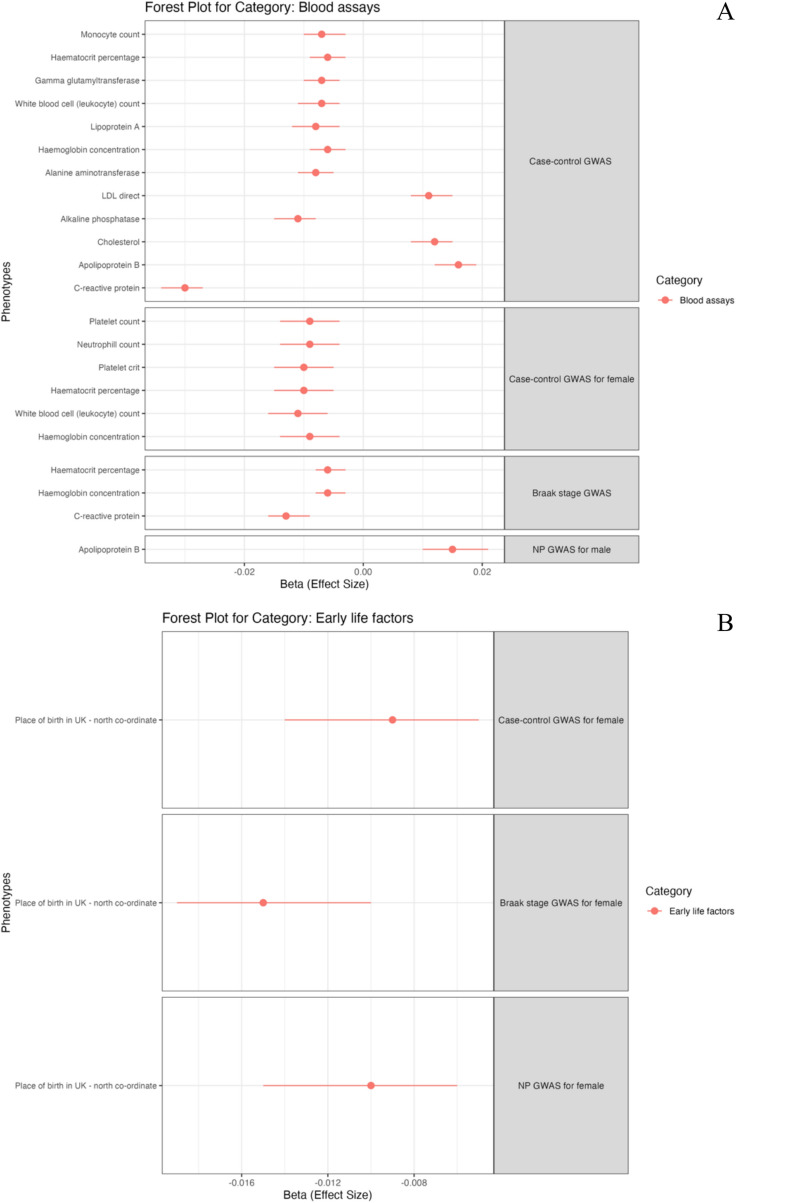
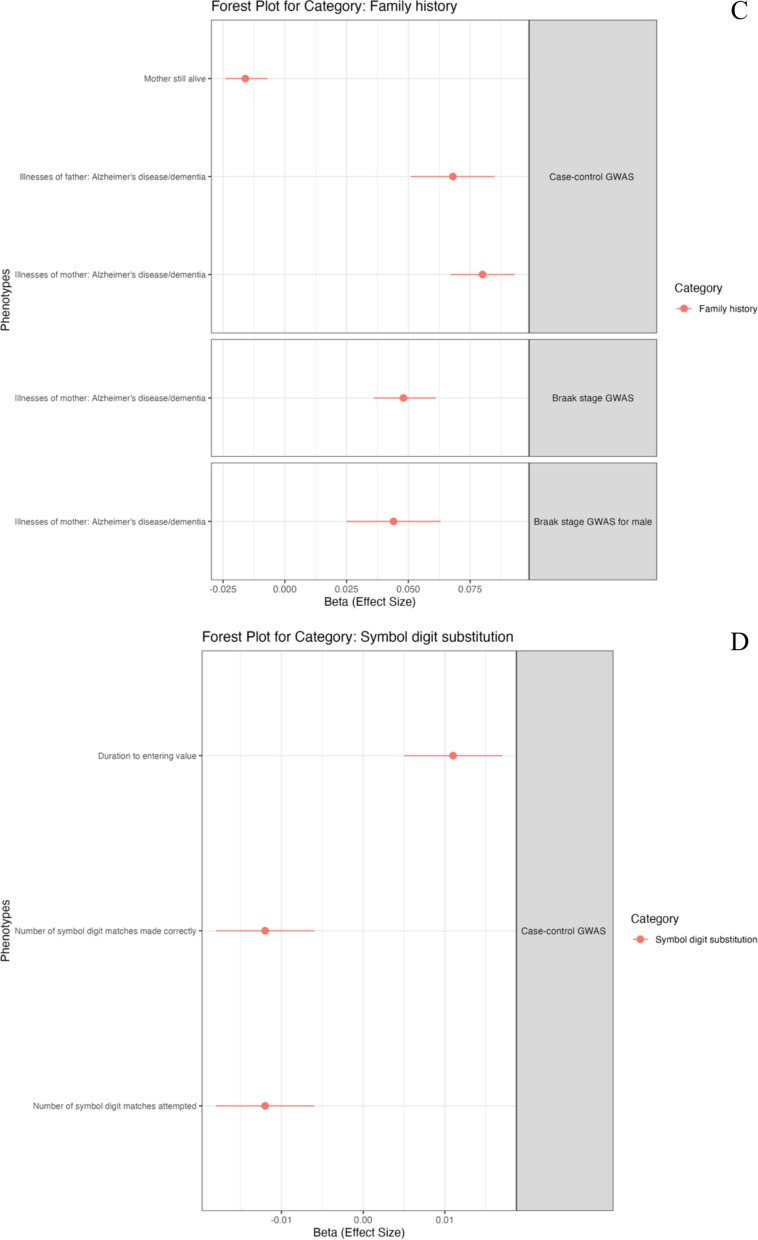
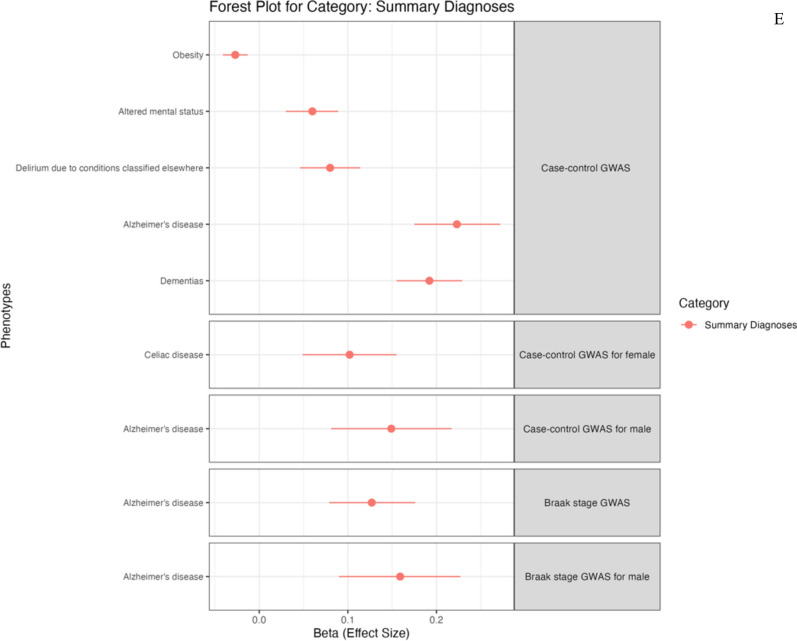
Fig. 6.
Phenome-wide association analysis (PheWAS) for PRS of neuropathology-based AD GWAS. Forest plot showing phenotypes significantly associated with TS PRS, grouped by categories The x-axis shows the (Beta) effect size for each phenotype estimated by PheWAS. A Forest plot for blood assay. B Forest plot for early life factors C Forest plot for family history. D Forest plot for cognitive function of symbol digit substitution. E Forest plot for ICD10 diagnosis summary


