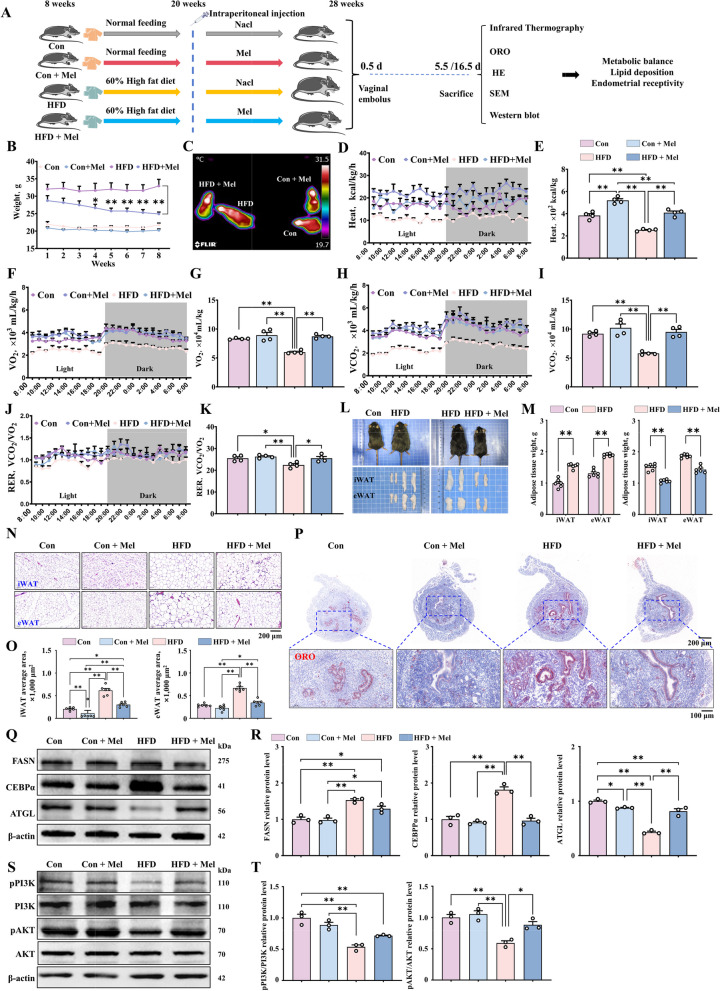
Fig. 6.
Alleviation of metabolic disorders caused by obesity and abnormal lipid deposition by melatonin treatment. A Modeling and treatment diagram of the mouse model. B Body weight change in mice (n = 20). C–E Heat production and body temperature change in mice (n = 4). F–K Carbon dioxide exhaled, oxygen consumption, and respiratory quotient in the mice. L and M iWAT and eWAT morphology and weight in different groups (n = 4). N iWAT and eWAT tissue samples from each group with HE staining (scale bar = 200 μm) (n = 6). O Lipid droplet area of iWAT and eWAT samples (n = 6). P Oil Red O staining of uterine tissue (scale bar = 500 μm/100 μm) (n = 4). Q and R The relative protein expression of FASN, CEBPα and ATGL (n = 3). S and T The relative protein expression of pPI3K, PI3K, pAKT, and AKT. *P < 0.05; **P < 0.01

